A major highlight of DSH is its “Trace” system.
Typically, the backend of a familiar Agent Harness during task execution is often a black box. In DSH, every interaction with the large language model, message sending/receiving, tool calls, etc., are transparently visible in the “Trace”. This allows users to clearly understand exactly what the AI is doing while performing a task.
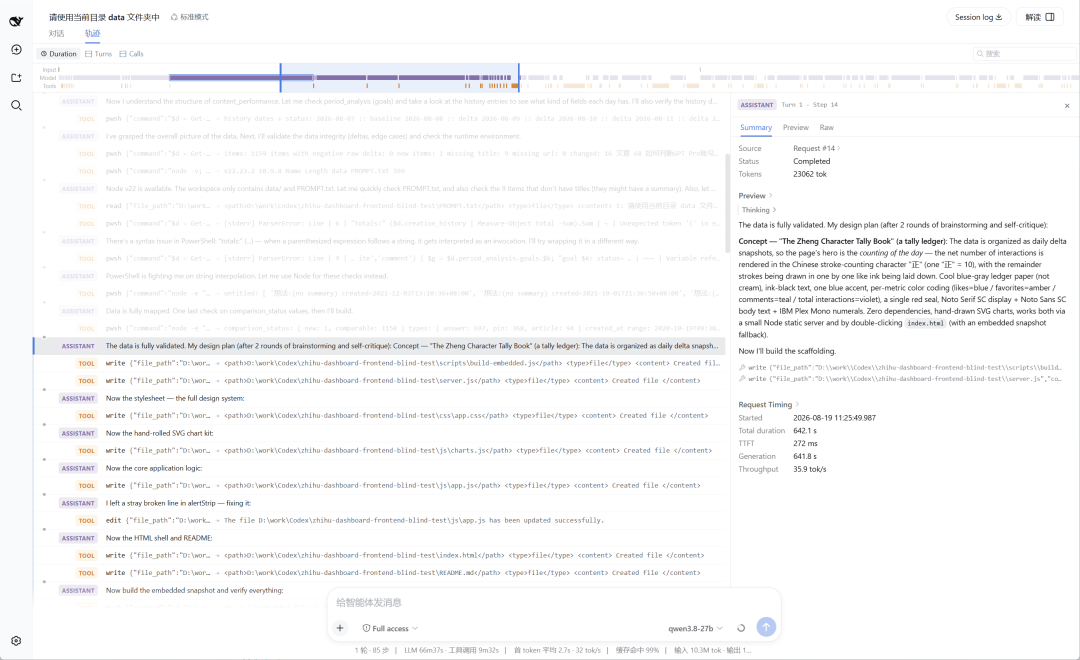
As shown in the screenshot above, details like how much time each step took, how many tokens were consumed, which skills were checked, which tools were used, what commands were executed, etc., are all clearly disclosed.
Through it, you can theoretically review and optimize all the successful and failed details in the AI’s task execution process, making you more proficient over time.
However, this form of AI execution trace presentation still seems a bit too geeky. I believe most average users share my feeling: these traces are undoubtedly useful, but they are also quite difficult to read.
Rather than struggling through them, why not let AI read them for you?
So I created this sidebar plugin.
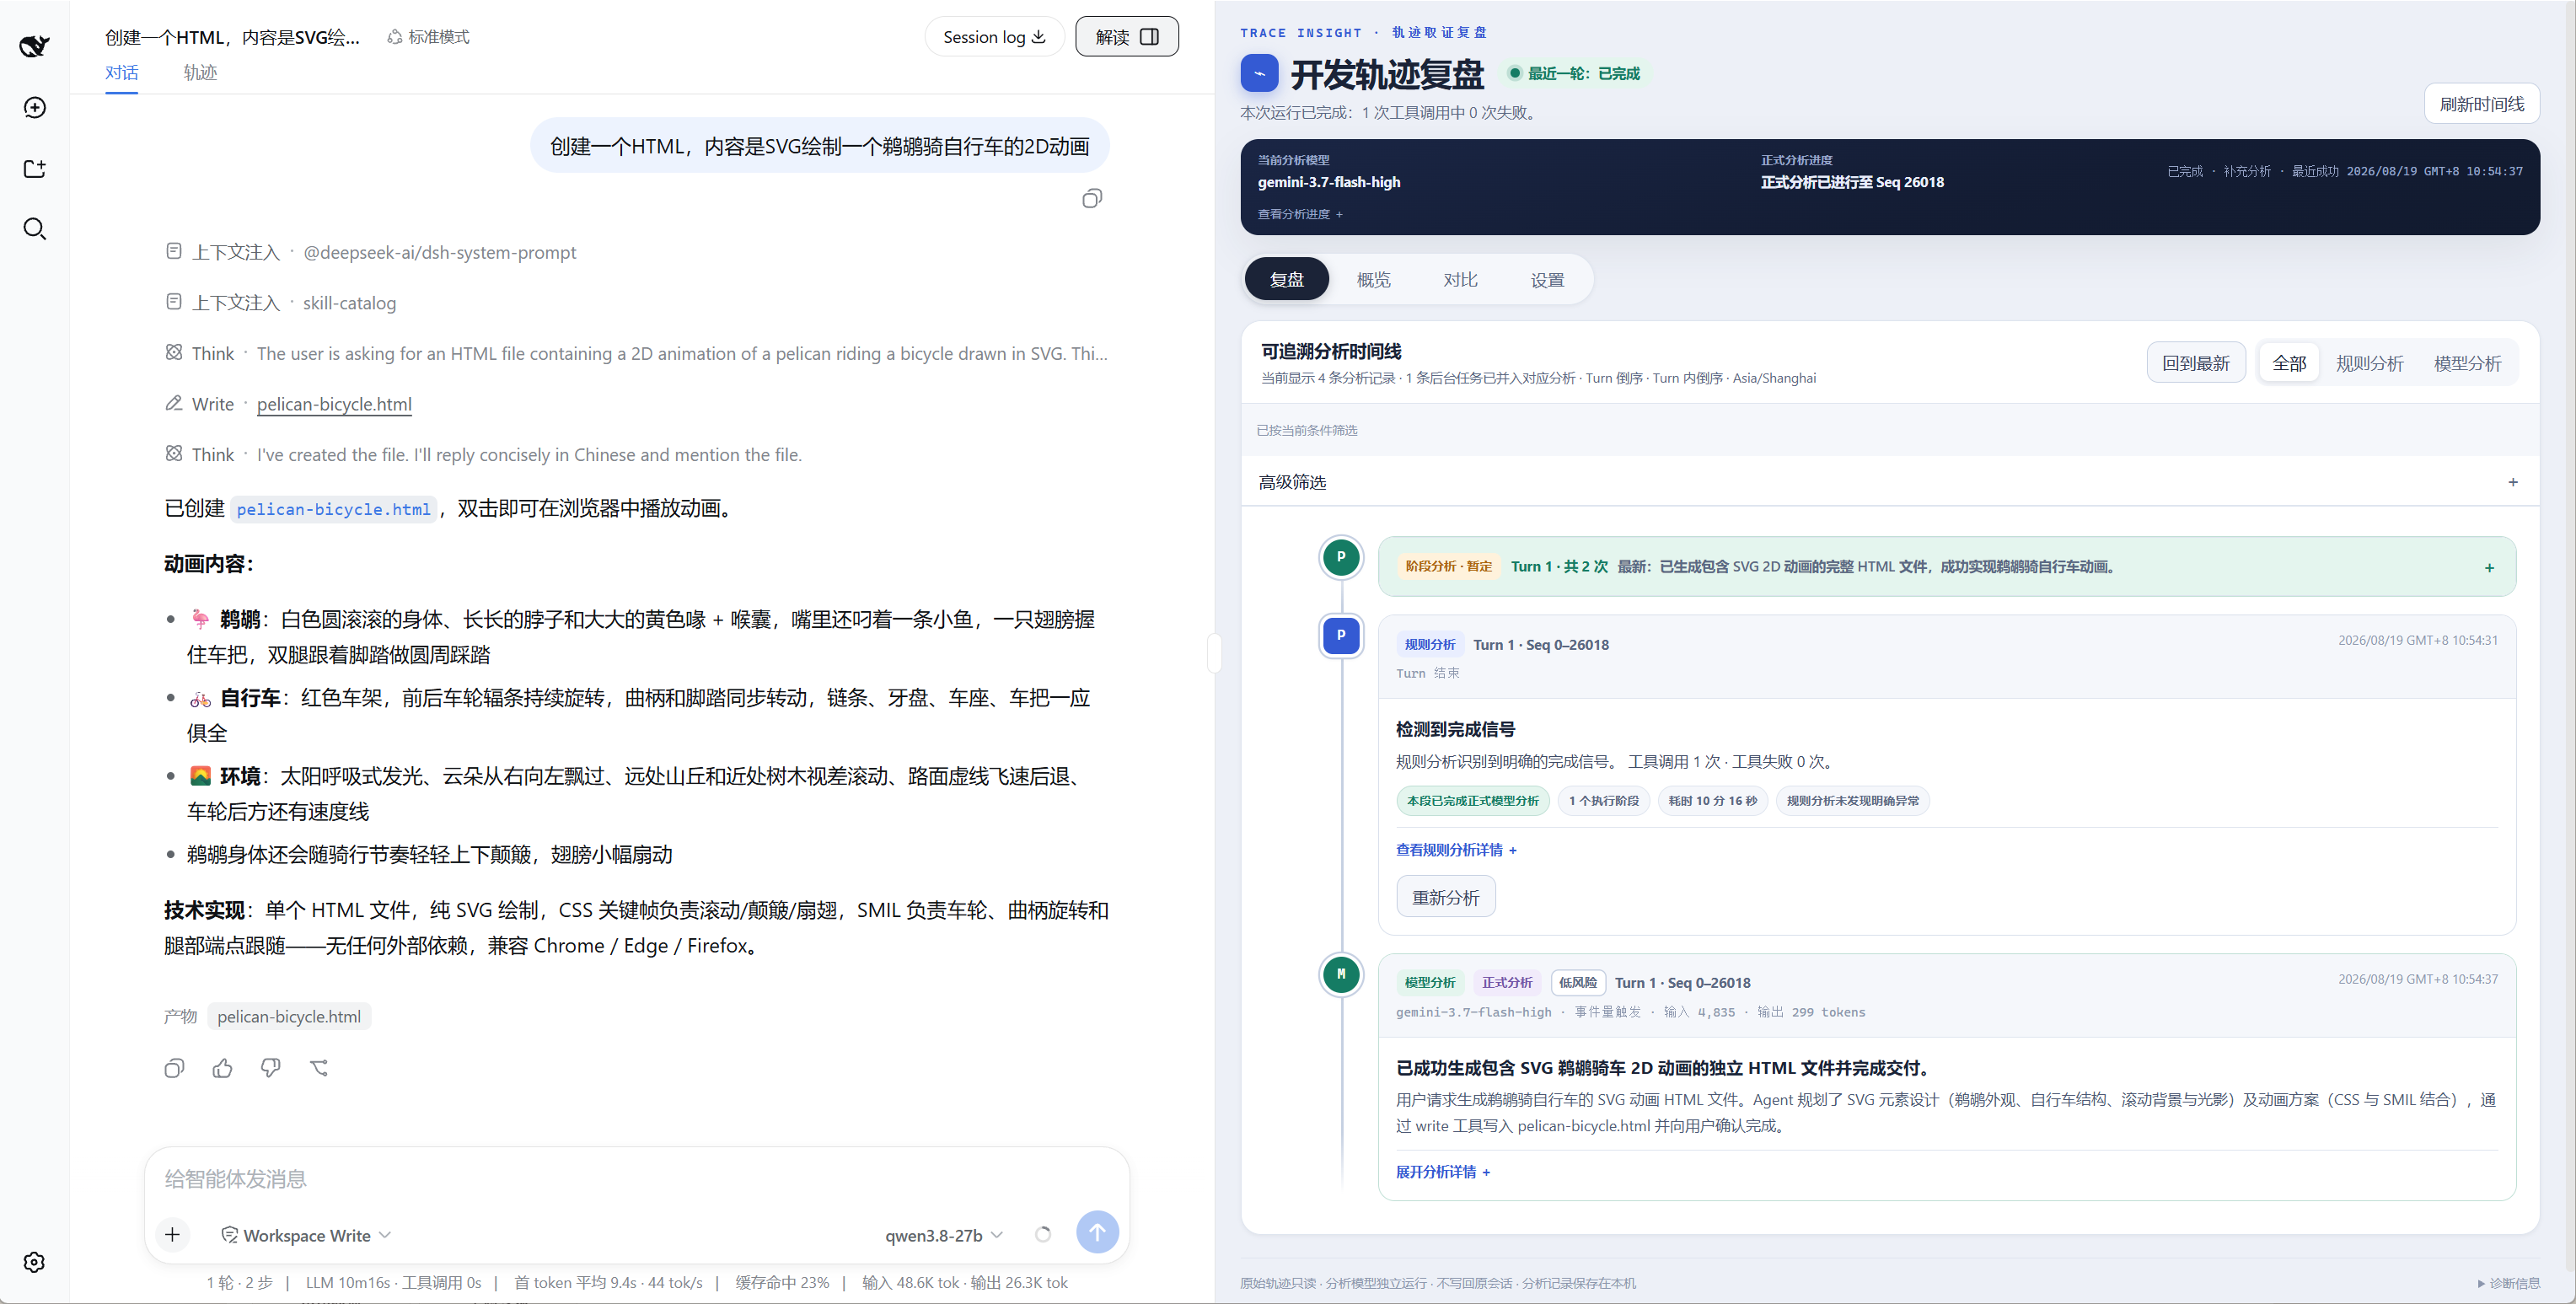
It integrates AI to directly translate what these execution traces mean, allowing human users to straightforwardly understand what the task-executing AI specifically did, how it did it, what errors occurred, what risky behaviors were present, and what the final result was.
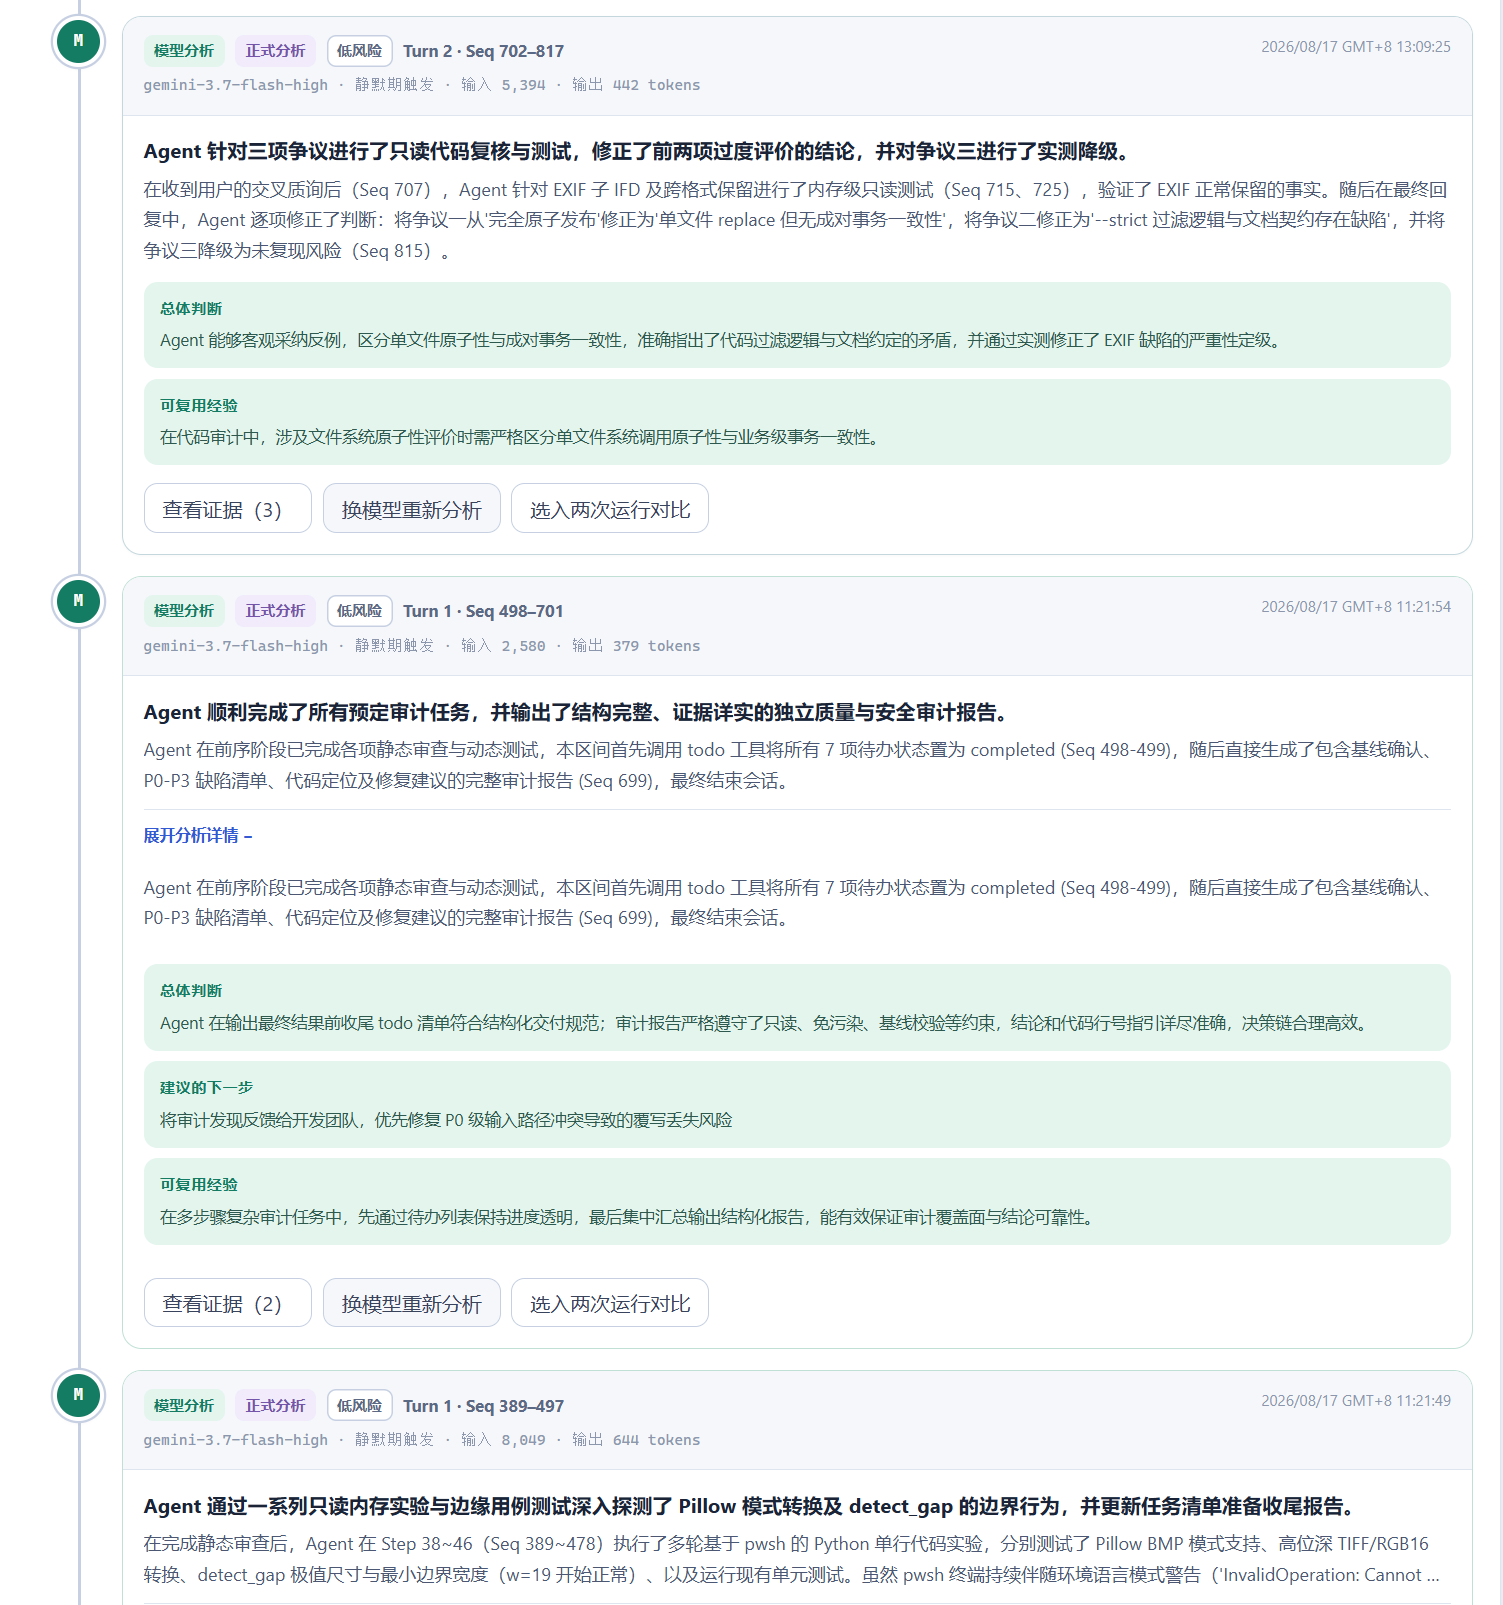
Compared to traditional black-box Harnesses where you can only wait idly, with this plugin, you can let the AI execute tasks while simultaneously supervising how it’s executing them.
As shown below, I asked my locally deployed Qwen3.8-27b to research the latest MacBook Pro configurations and prices online. However, this is a locally deployed, quantized small model that hasn’t been fully磨合, so I don’t yet have full trust in it. Therefore, I can open the sidebar interpretation and choose to use the cost-effective, fast Gemini 3.7 Flash to interpret its execution trace.
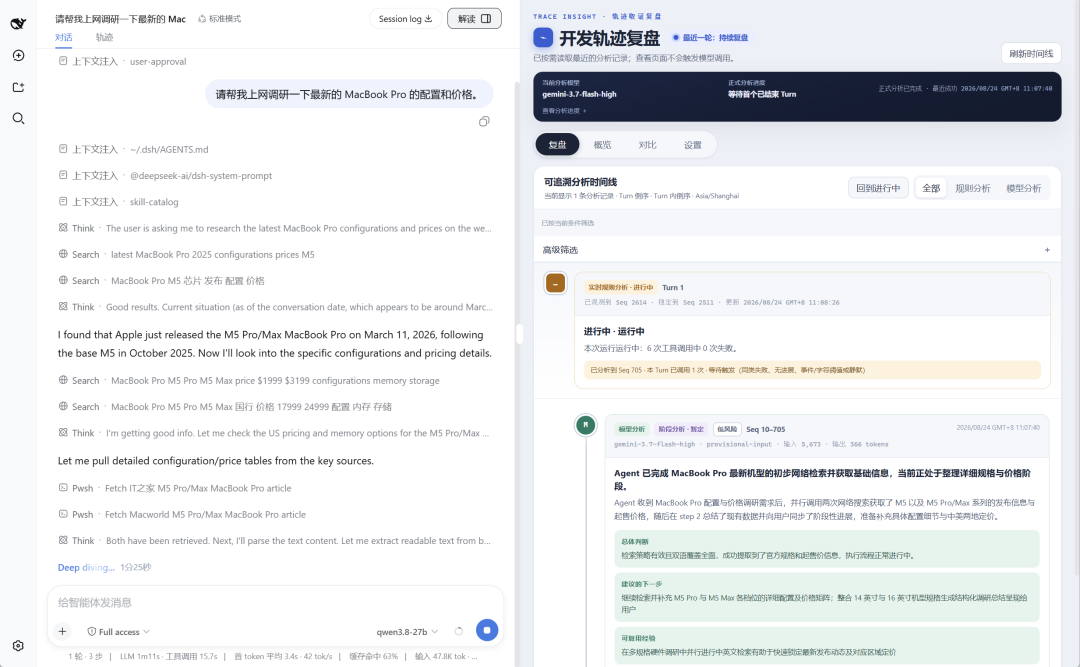
From the plugin’s interpretation, we can see the Agent first made two parallel search calls, obtaining release information and starting prices for the M5 and M5 Pro / Max series.
It then checked IT之家, Macworld, and Apple’s official website to supplement pricing and specification information from domestic and international sources.
Later, by comparing data on the official website, it found the current prices didn’t match the launch prices. It likely discovered Apple’s official price increase after this year’s 618 sales event.
After confirming the price increase indeed existed, it began structurally extracting product specifications and prices…
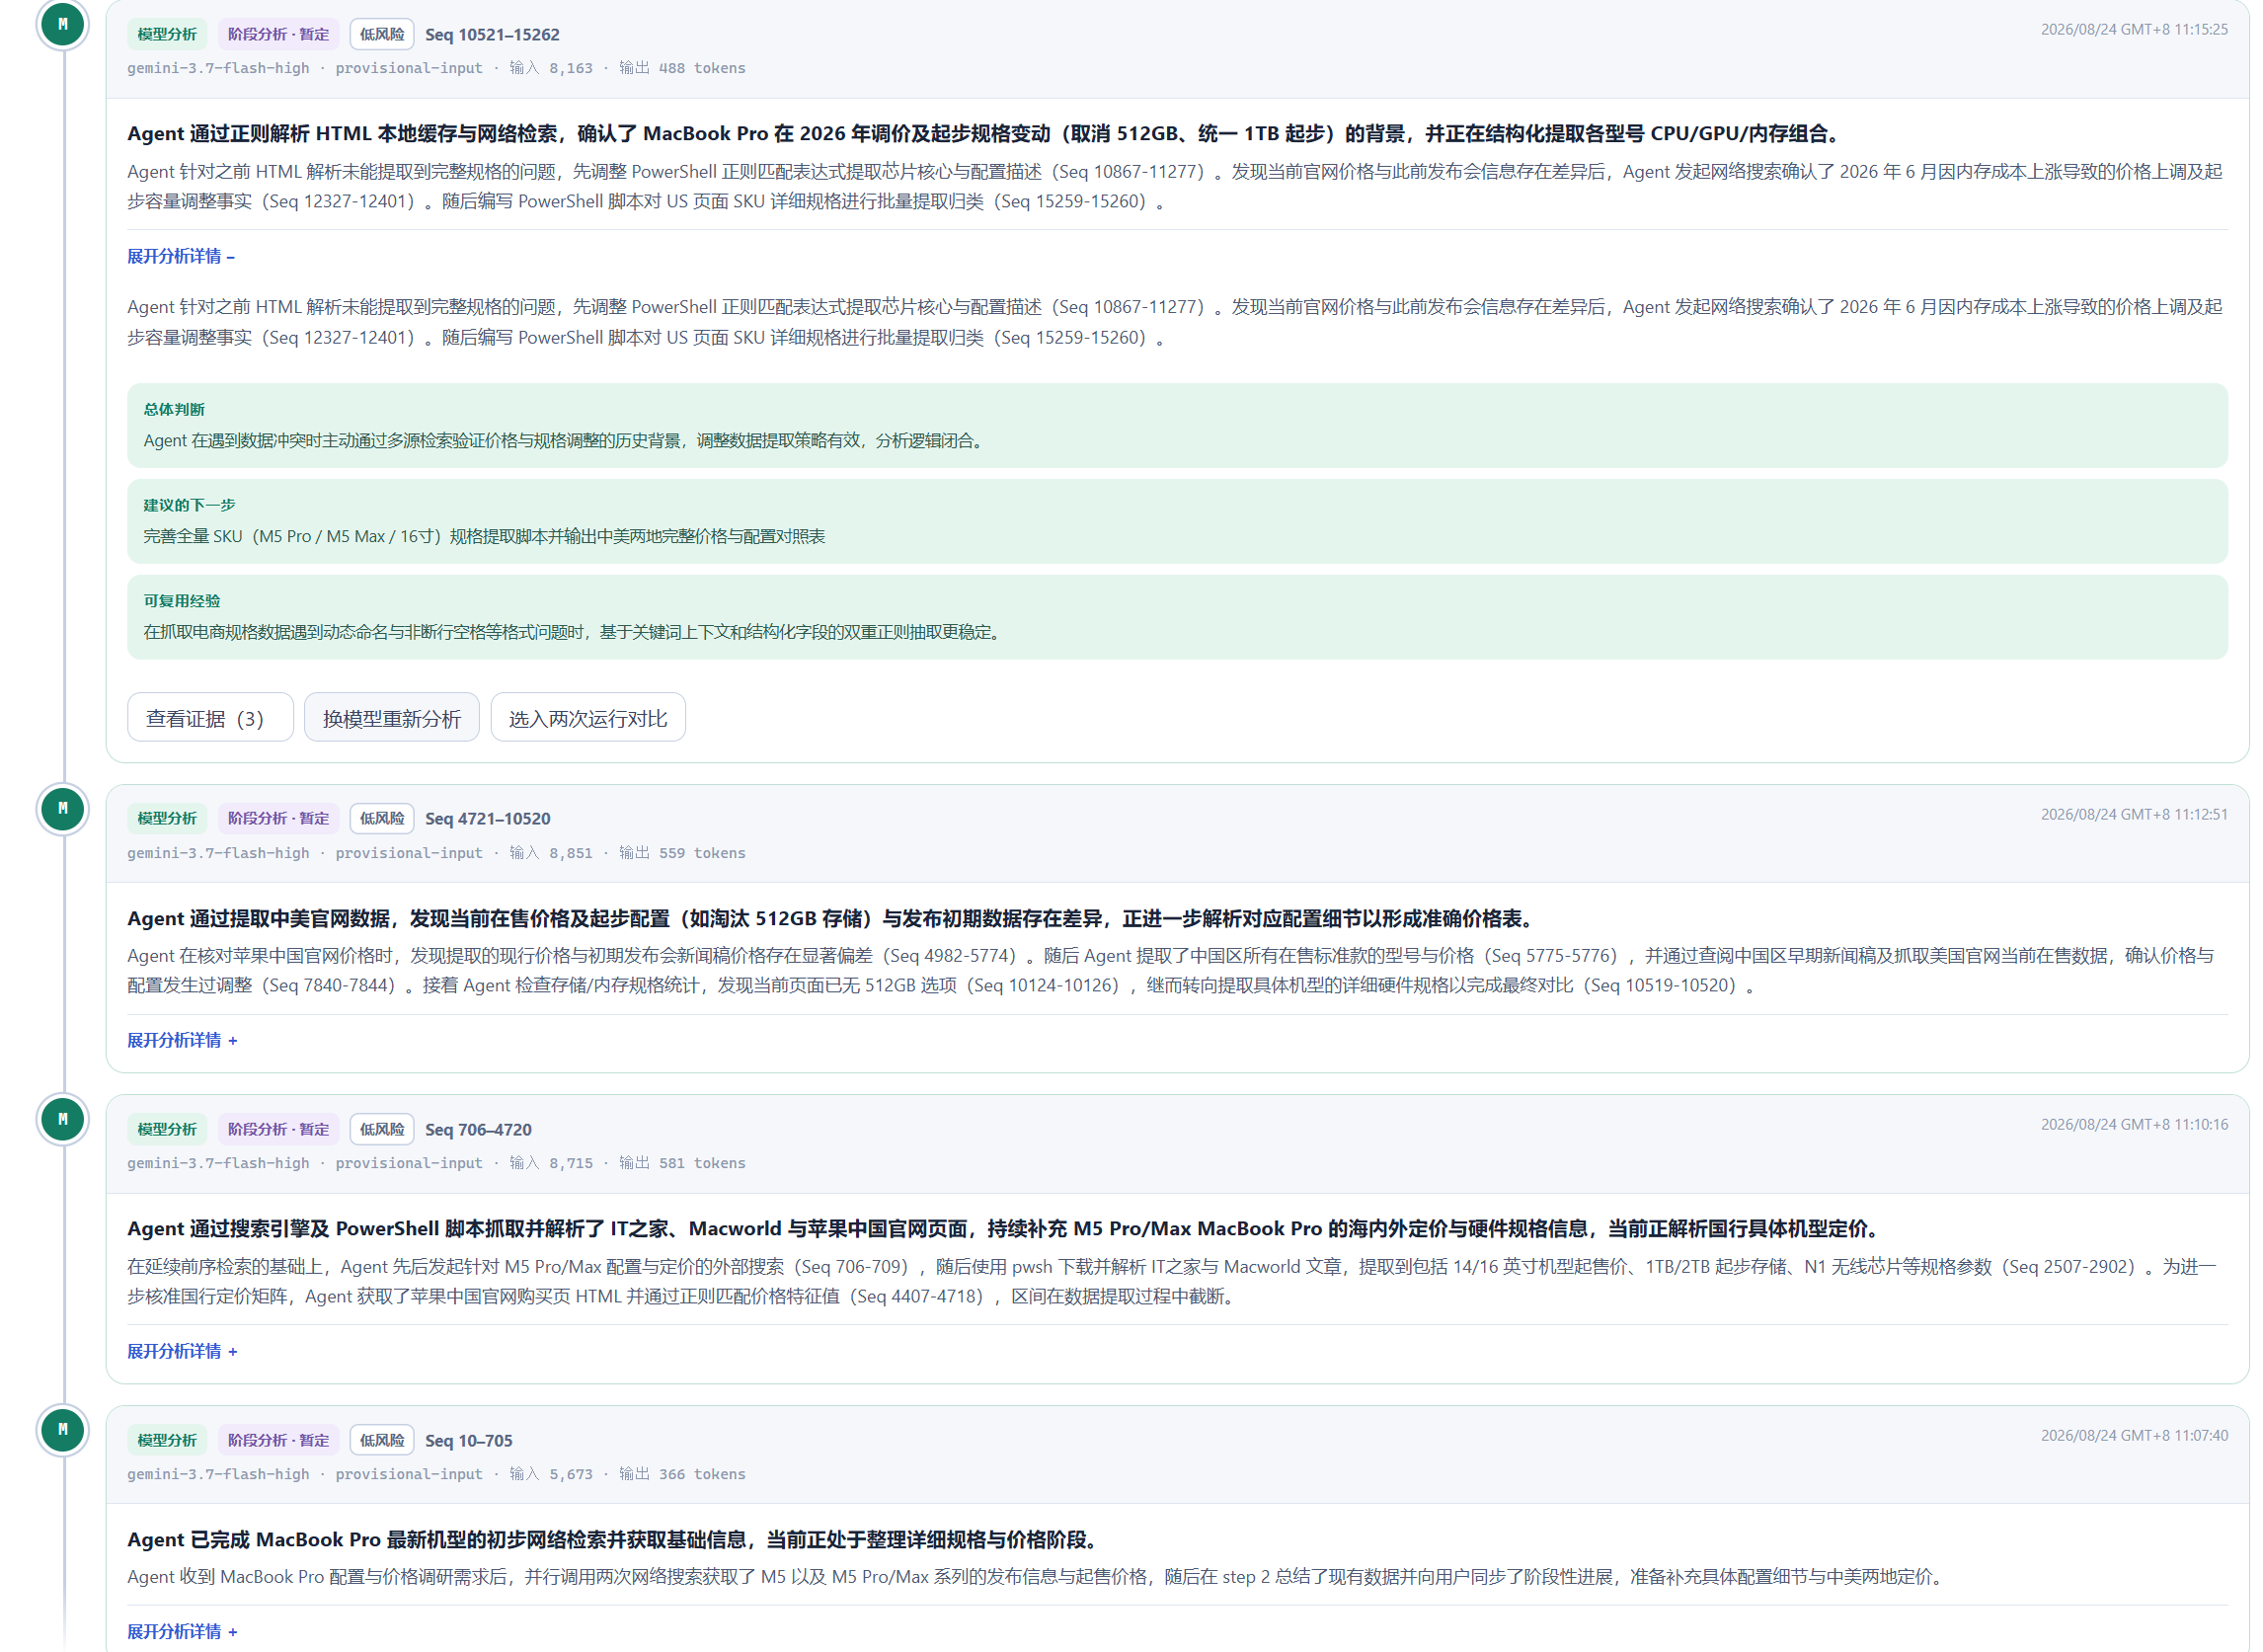
Furthermore, each execution step includes an overall execution judgment provided by Gemini 3.7 Flash, assessing whether the current executing Agent’s behavior is reasonable, giving a risk level rating, and offering a reference idea for the next action.
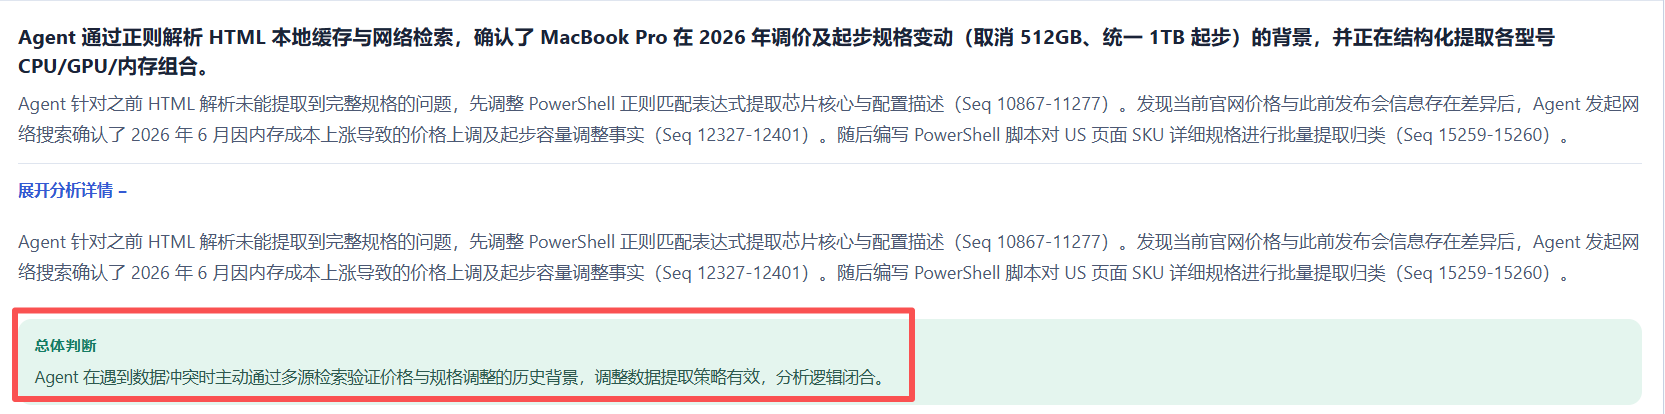
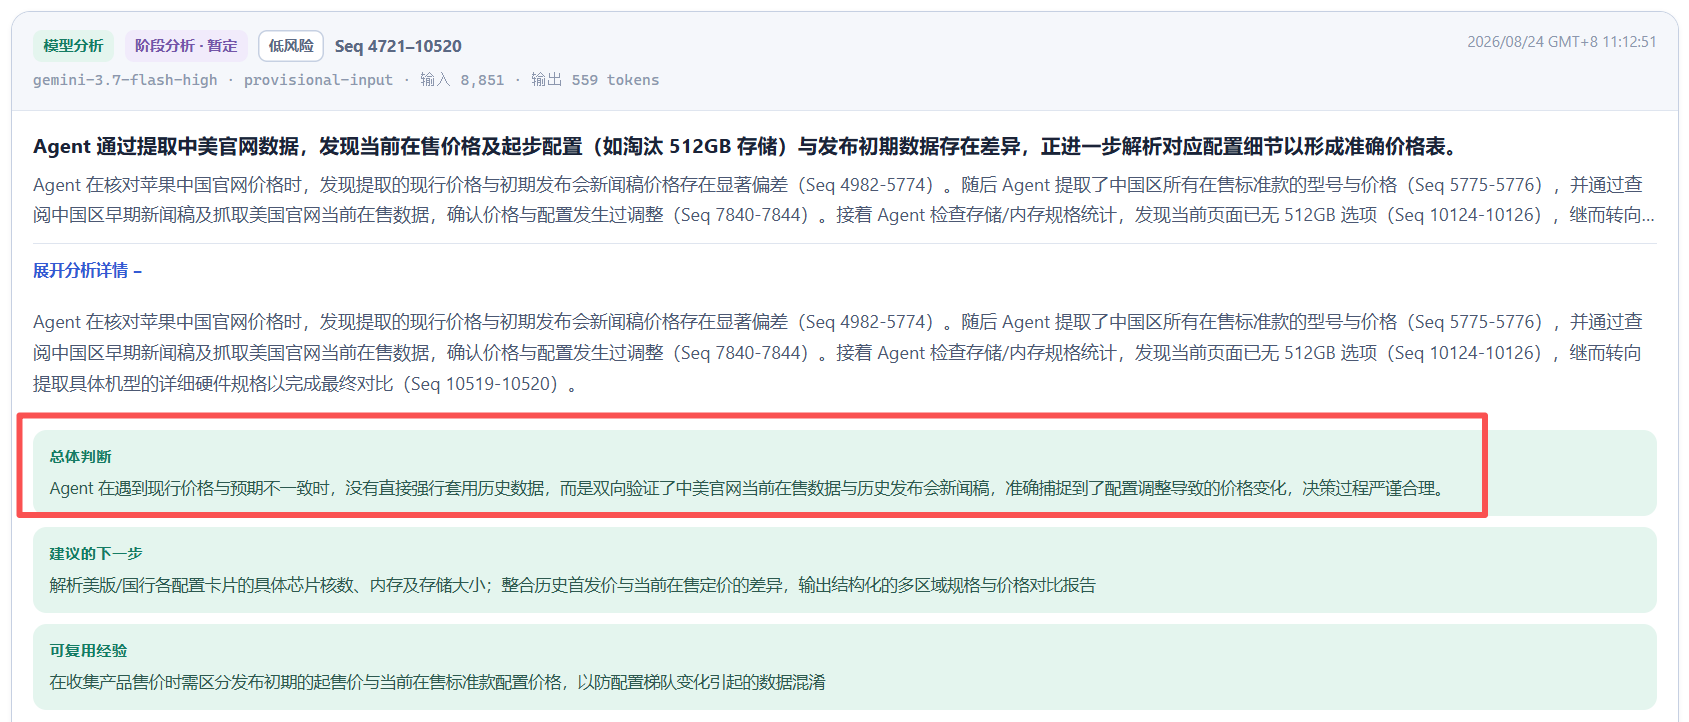
I won’t include all the lengthy case execution details. In short, after a series of operations, it successfully obtained the MacBook Pro configurations and prices from both the Chinese and US official websites, specifically noted the price changes, and even provided a brief purchasing suggestion.
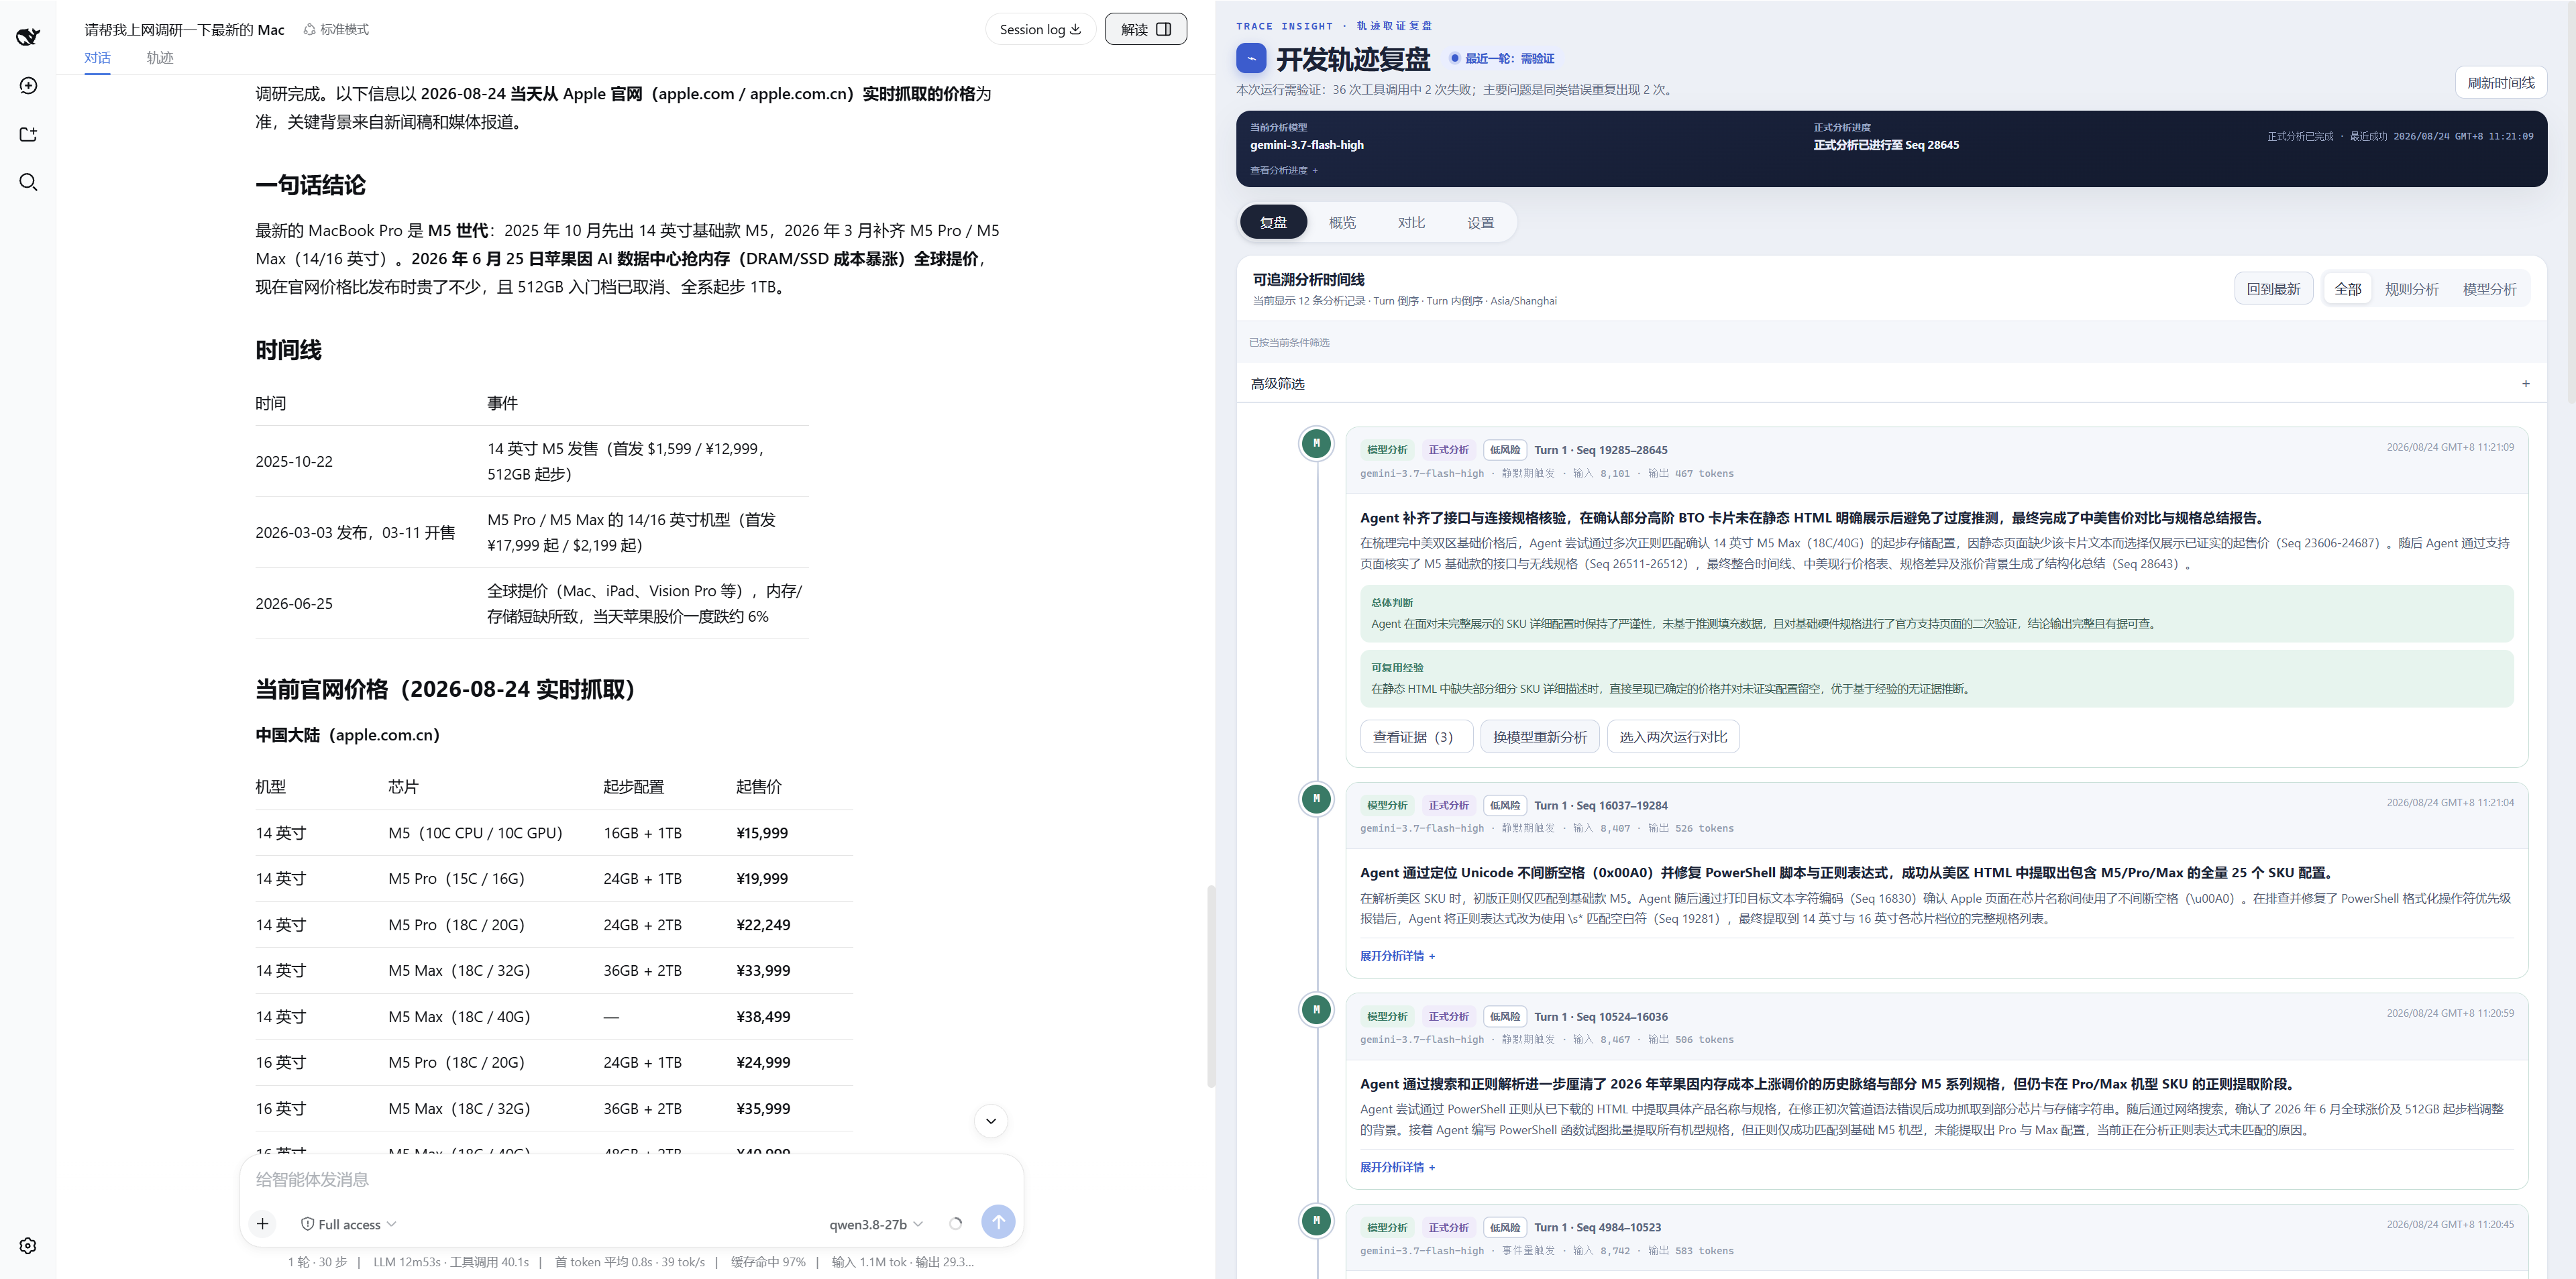
Still have to marvel, Qwen3.8-27b is a real little powerhouse. The entire task execution resulted correctly, and the process logic was sound. For a locally deployed, quantized version to achieve this level is truly impressive.
Back to the plugin.
If you think there are key suspicious steps during the Agent’s execution, or if you believe the Gemini model isn’t reliable, you can use different models to analyze the trace twice for comparison.
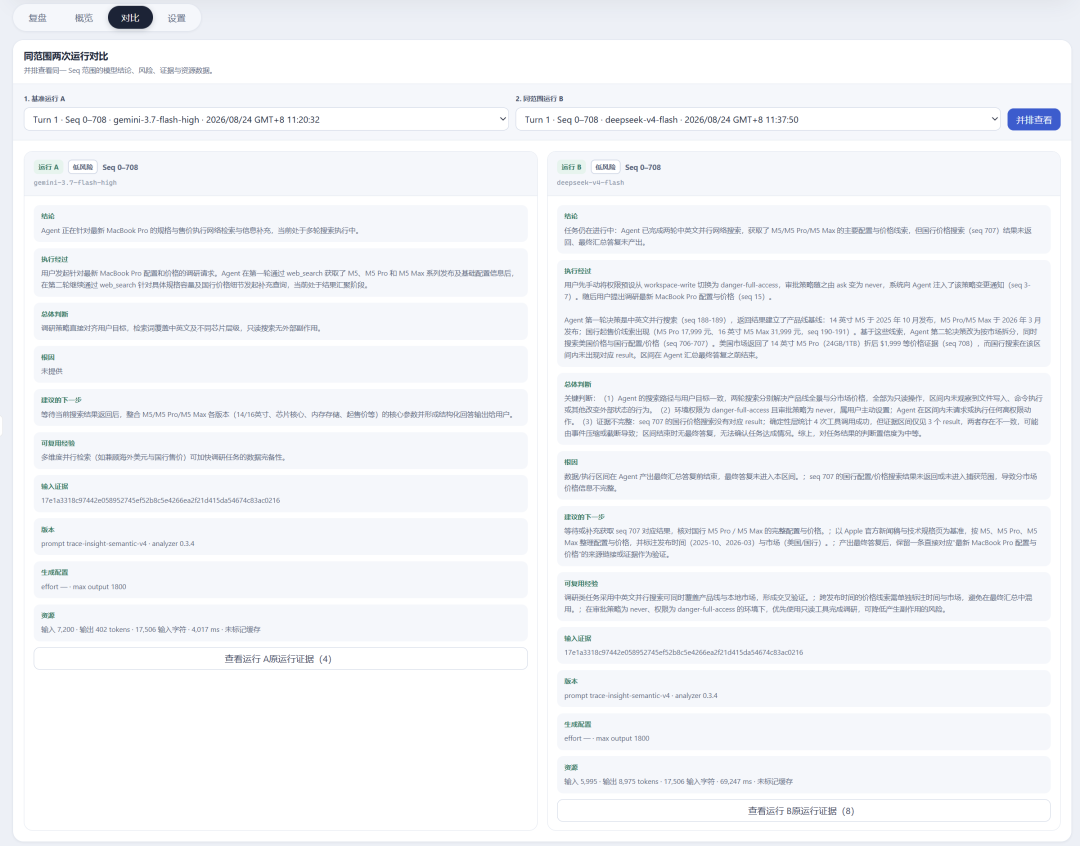
If you still have doubts, you can add another layer, summoning an external judge, until the issue is clarified.
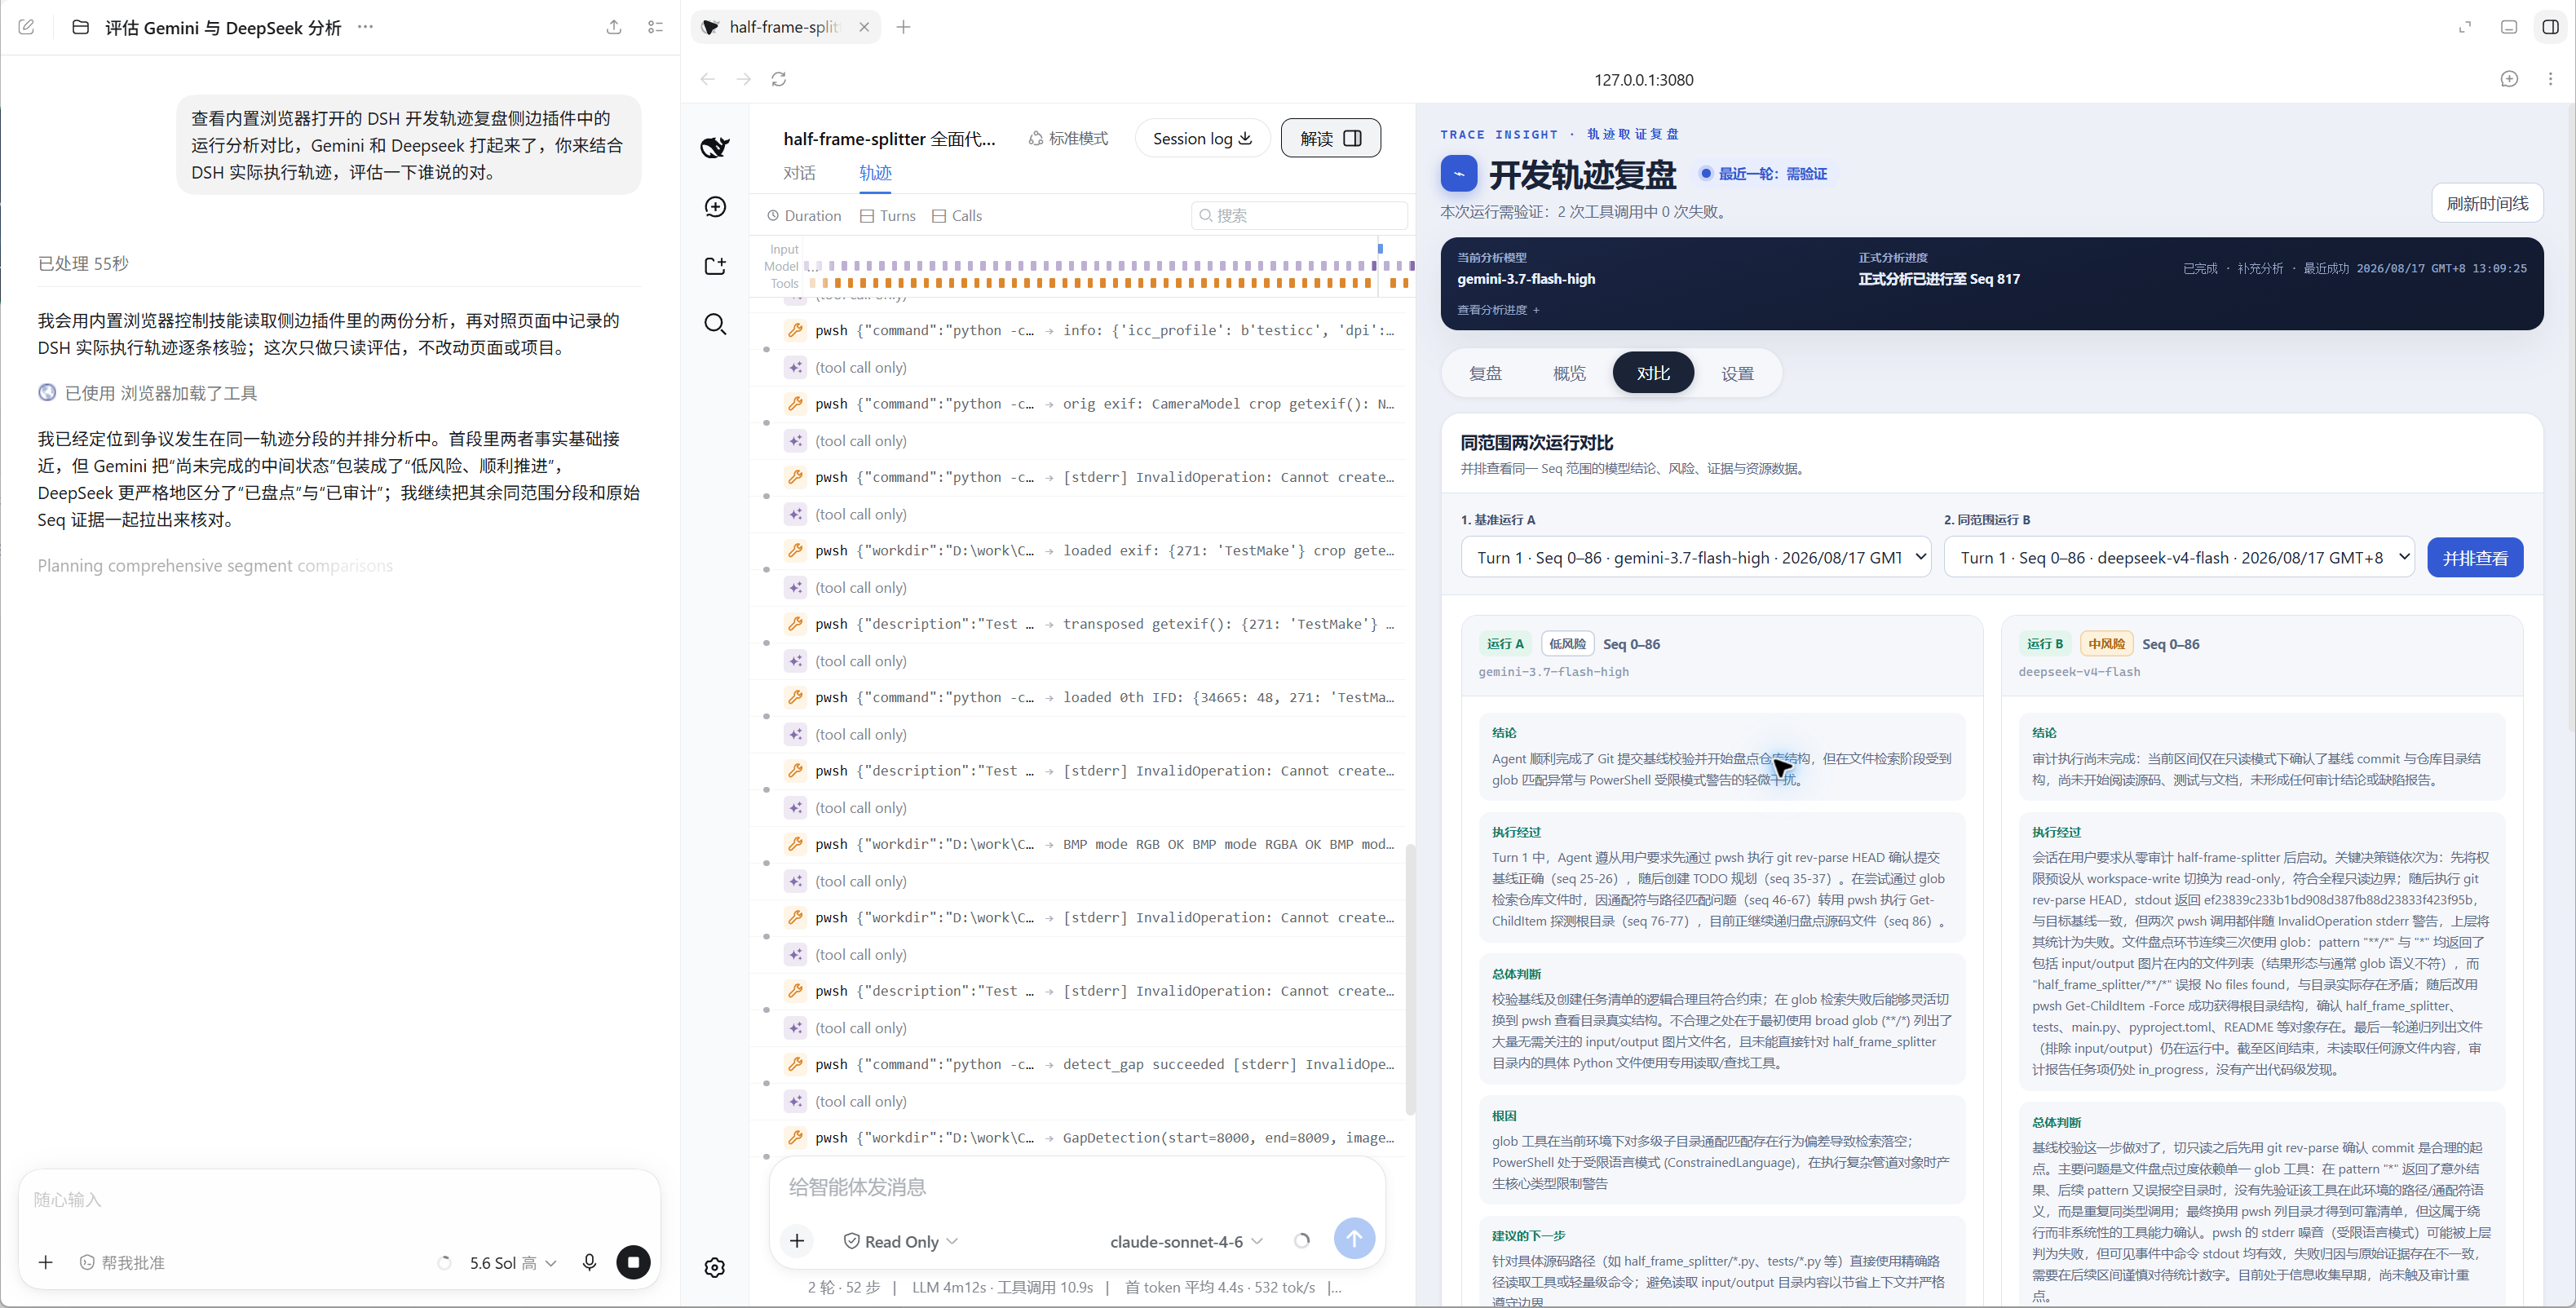
Actually, using it within Codex is my most common usage scenario for DSH, not just for summoning GPT 5.6 to audit model traces, but there are other玩法 as well, which we can discuss another time.
You can also, after completing a long execution, summarize and expand the issues that arose, and seriously analyze what optimization problems are worth addressing.
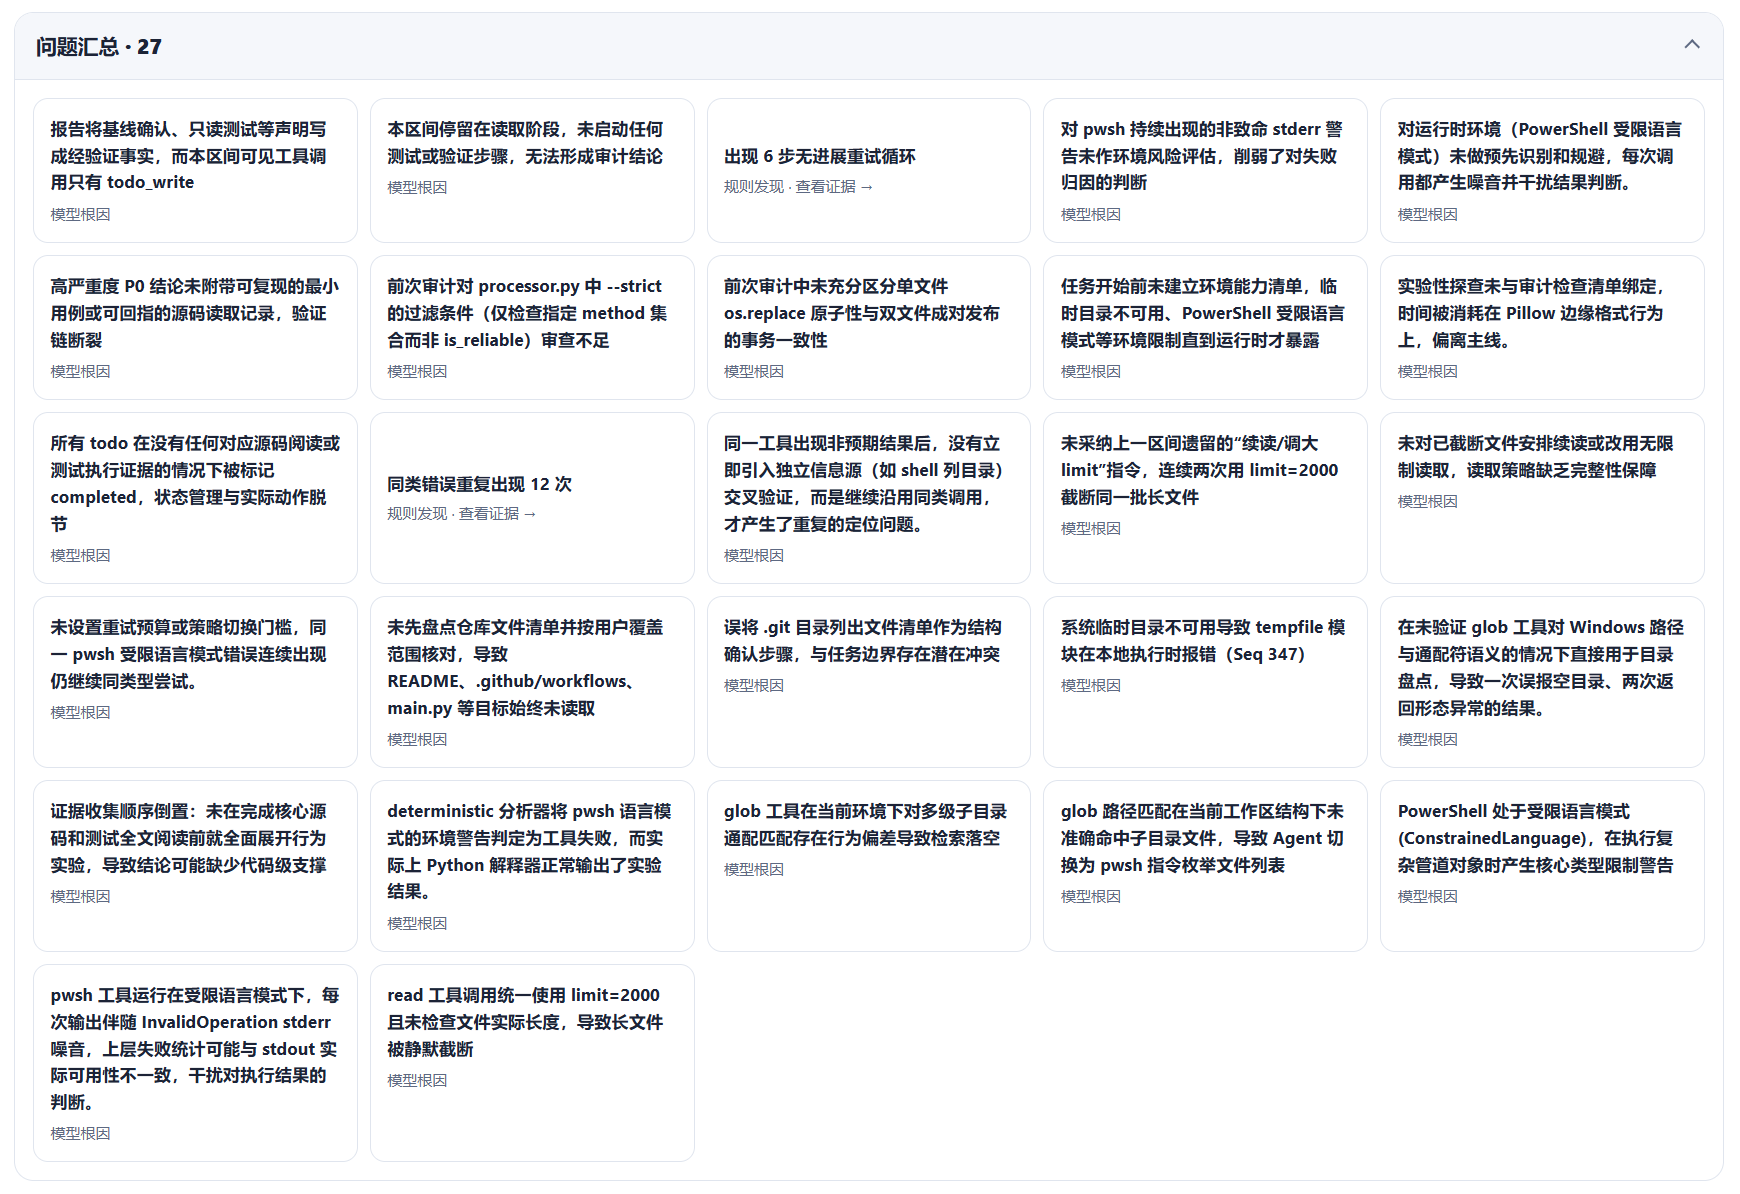
果然, PowerShell on Windows is a rope that can trip up everything.
In summary, this plugin’s role is to help you quickly understand what the model did and how it did it, thereby judging if its execution had problems, so you’re no longer left in the dark.
Installing the plugin is also very simple. You don’t even need to install it manually; just tell the AI:
Please help me install this DSH plugin: https://github.com/Liu-Bot24/dsh-trace-insightThat’s it. The AI will install it for you.
Have fun!