Let’s get straight to the point. The prompt is:
Please use Mermaid to draw………
To avoid a dry explanation, let’s first show the result.
Input prompt:
Create a 30-day vacation weight loss plan, and draw it as a Gantt chart using Mermaid
The output Gantt chart:
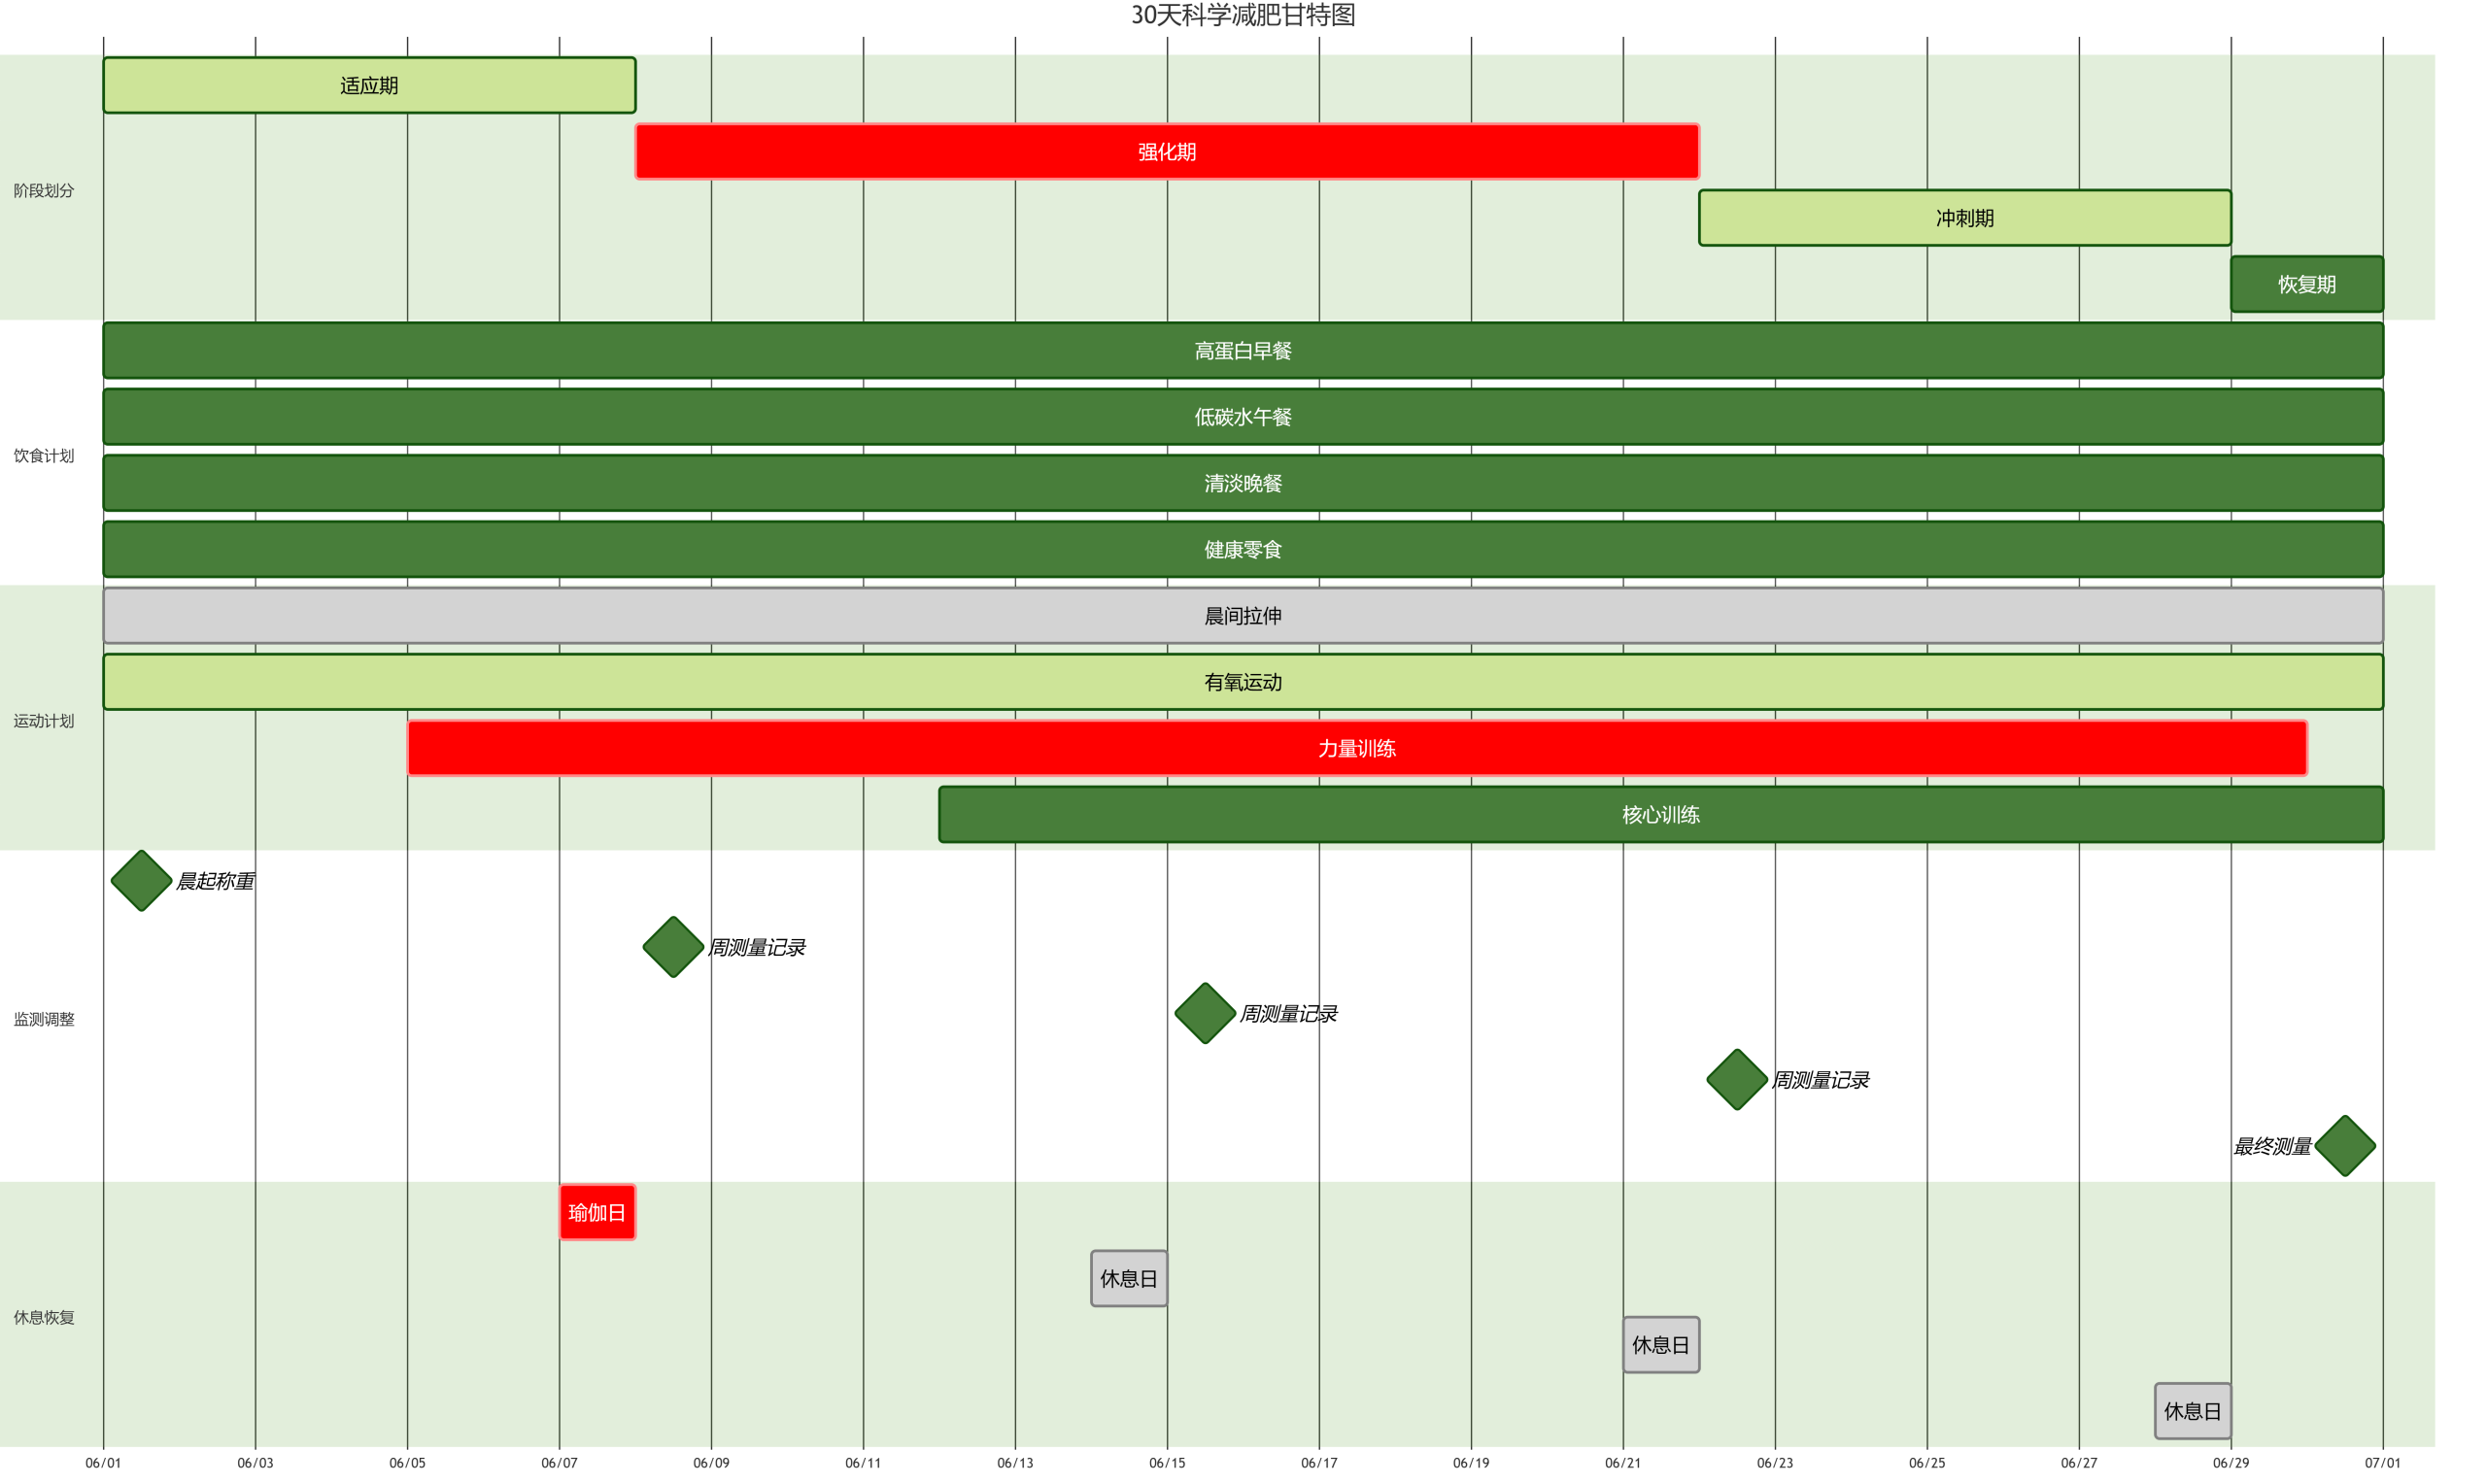
How about that? The effect is pretty good, right?
Let’s continue.
We’ve previously introduced Markdown:Why do AI answers always come out with useless symbols like 「##」, 「**」, 「-」? How can I remove them?
Markdown can represent various formats through simple text syntax. What we’re discussing today is similar—it allows creating multiple types of charts using simple text syntax and renders them visually based on JavaScript. It’s called Mermaid.
The weight loss plan mentioned earlier actually looks like this in the AI chat window:
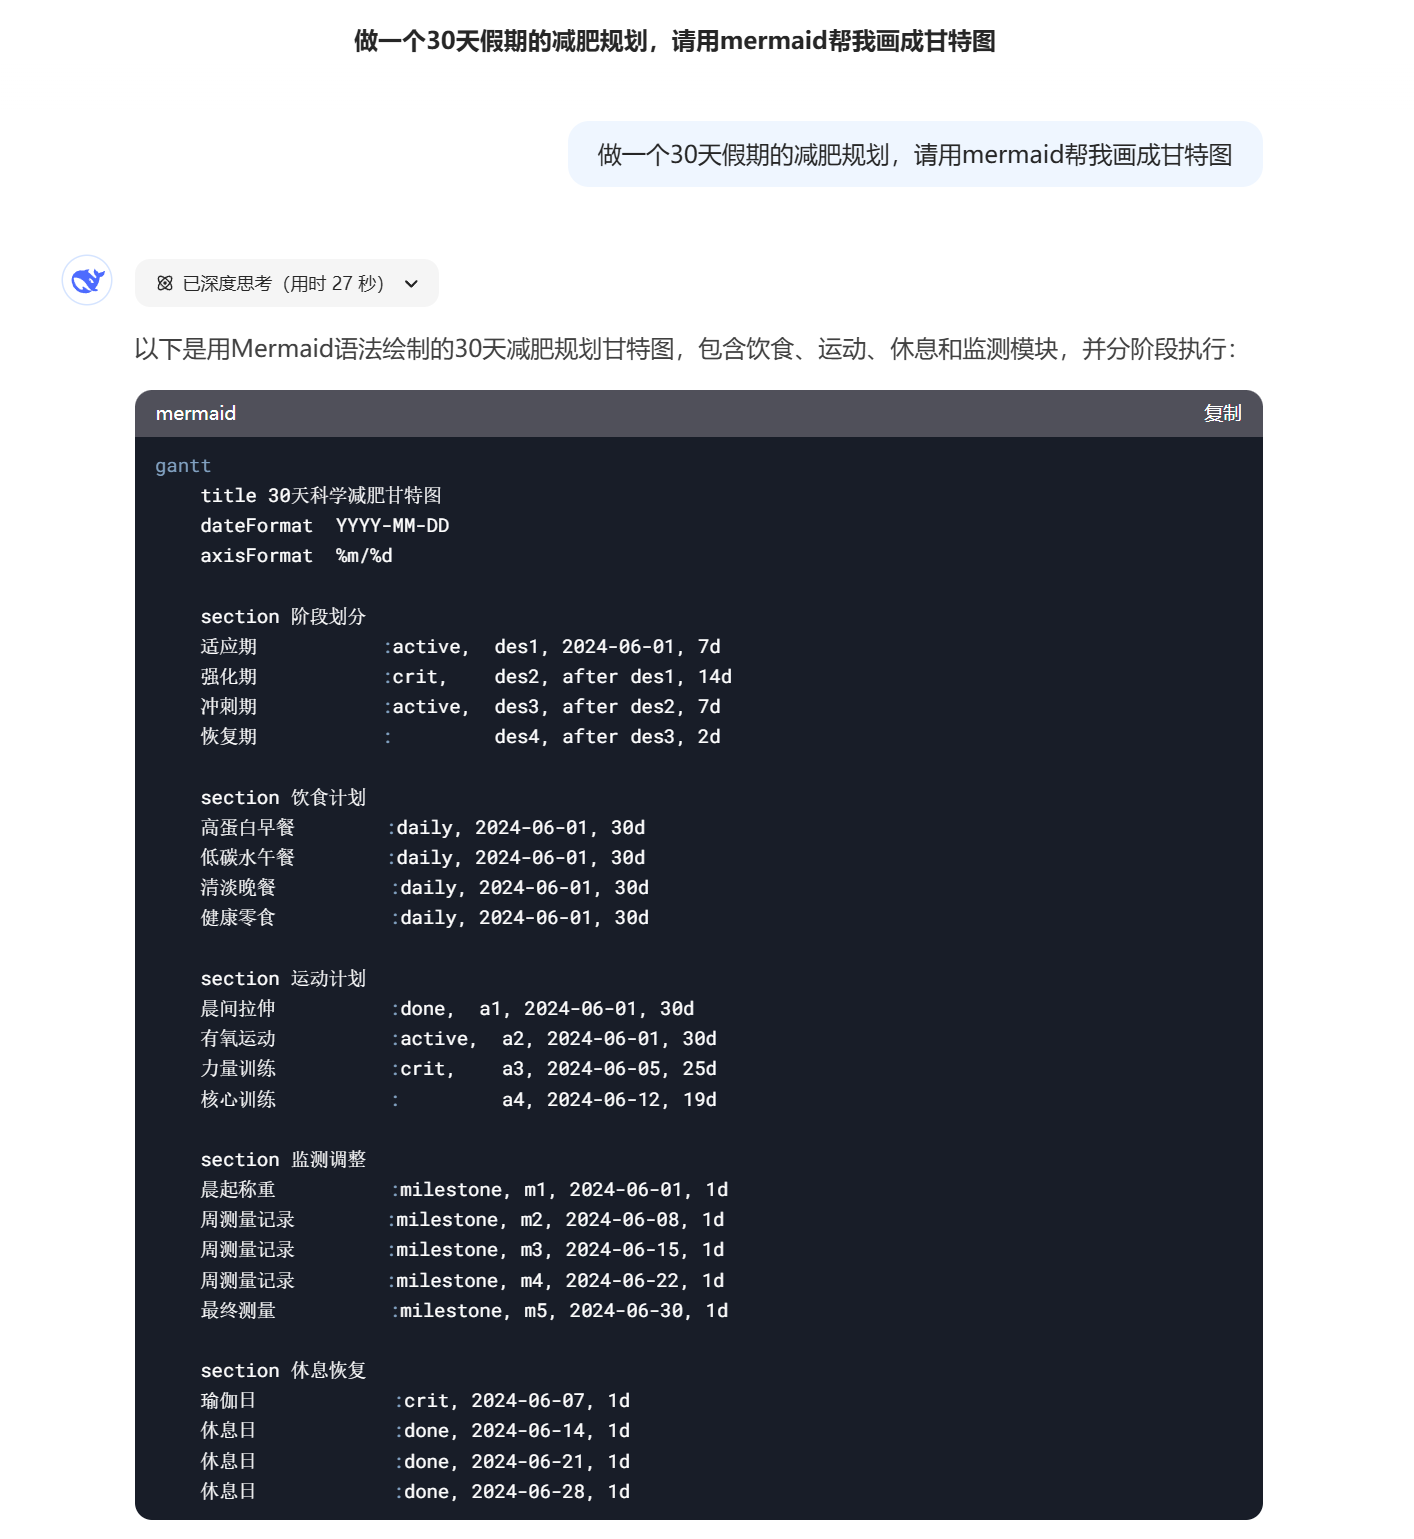
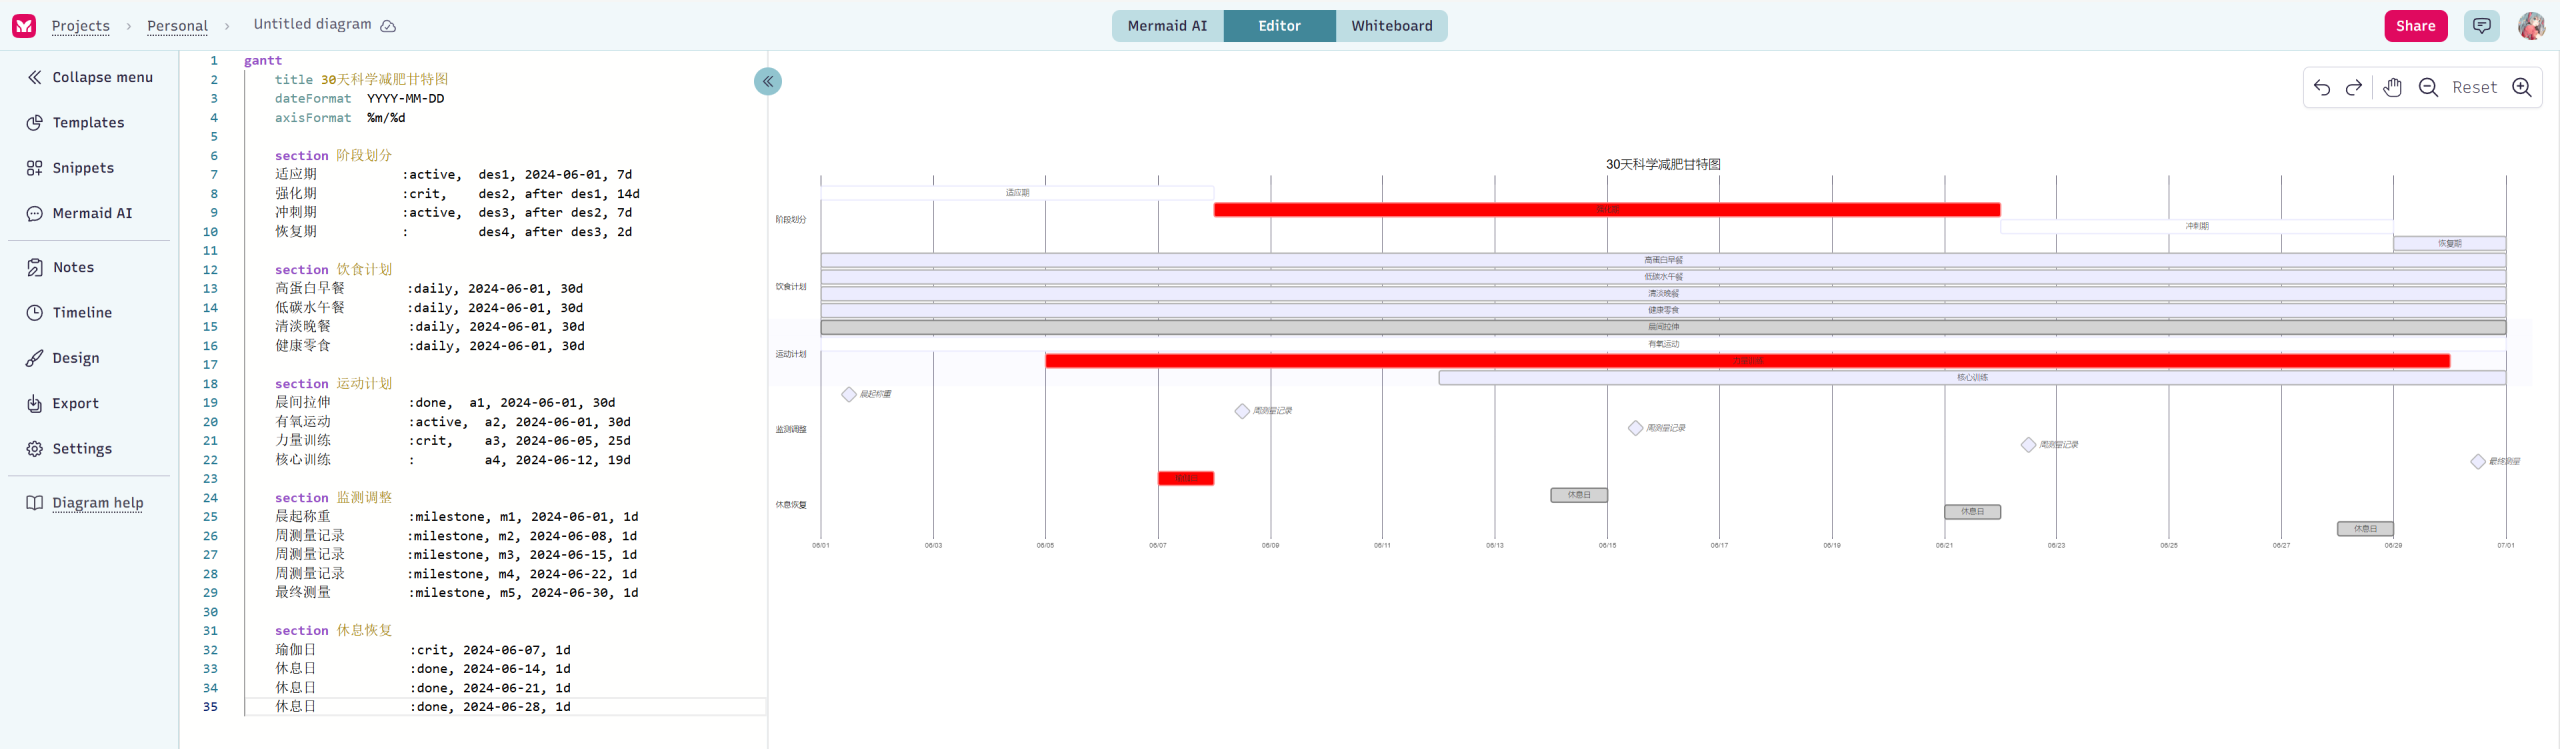
Click the copy button in the top right corner of the code block, then paste it into a website that provides Mermaid rendering functionality, such as mermaidchart.com or mermaid.live, to convert it into a visual chart.
Let’s set up a few specific scenarios to demonstrate.
1. For example, today we read an article on the website ‘Everyone is a Product Manager’ about the ‘Standard SOP Process for Event Planning.’ I want to organize and summarize it.
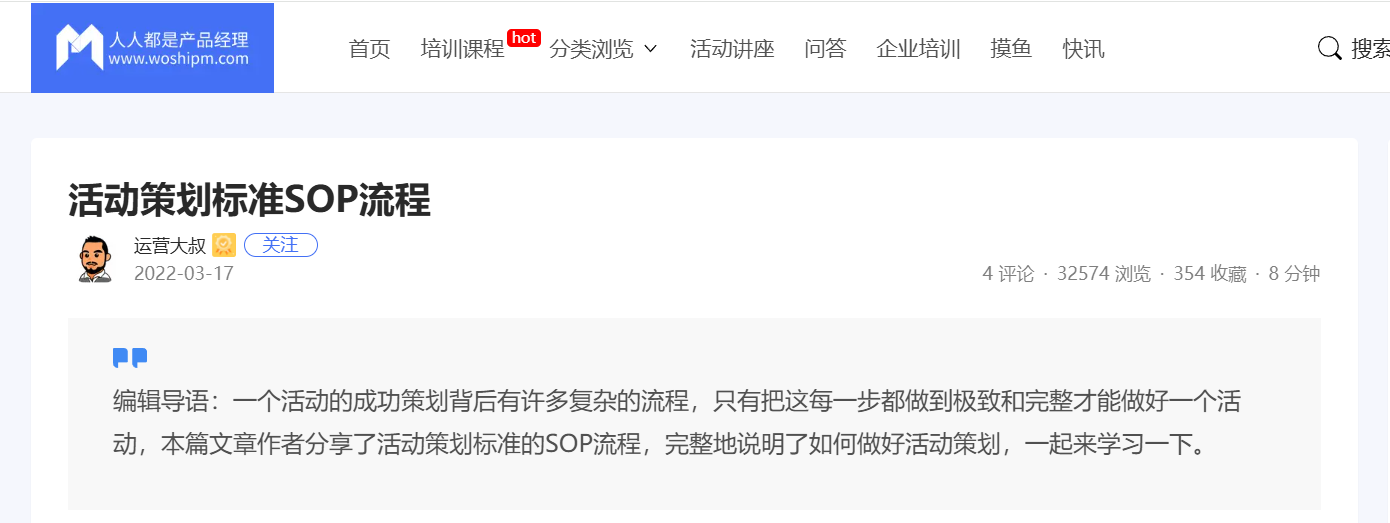
I can copy the entire article and then tell DeepSeek-R1: ‘Please organize the following article into a Mermaid chart.’
Thus, we obtain a chart that resembles a mind map.
The original text of this example article is not very complex, and it contains many images, so the resulting chart is relatively simple. If you use your company’s internal processes or SOPs, or courses you are currently studying, you will achieve better results.
2. Draw an industry knowledge graph. For example, draw a knowledge graph for the large language model industry.
Thus, we obtain a knowledge graph.

3. Please use mermaid to draw the shopping journey of users entering the Uniqlo Tmall live streaming room and placing orders on Double Eleven.
Thus, we obtain a user journey map.

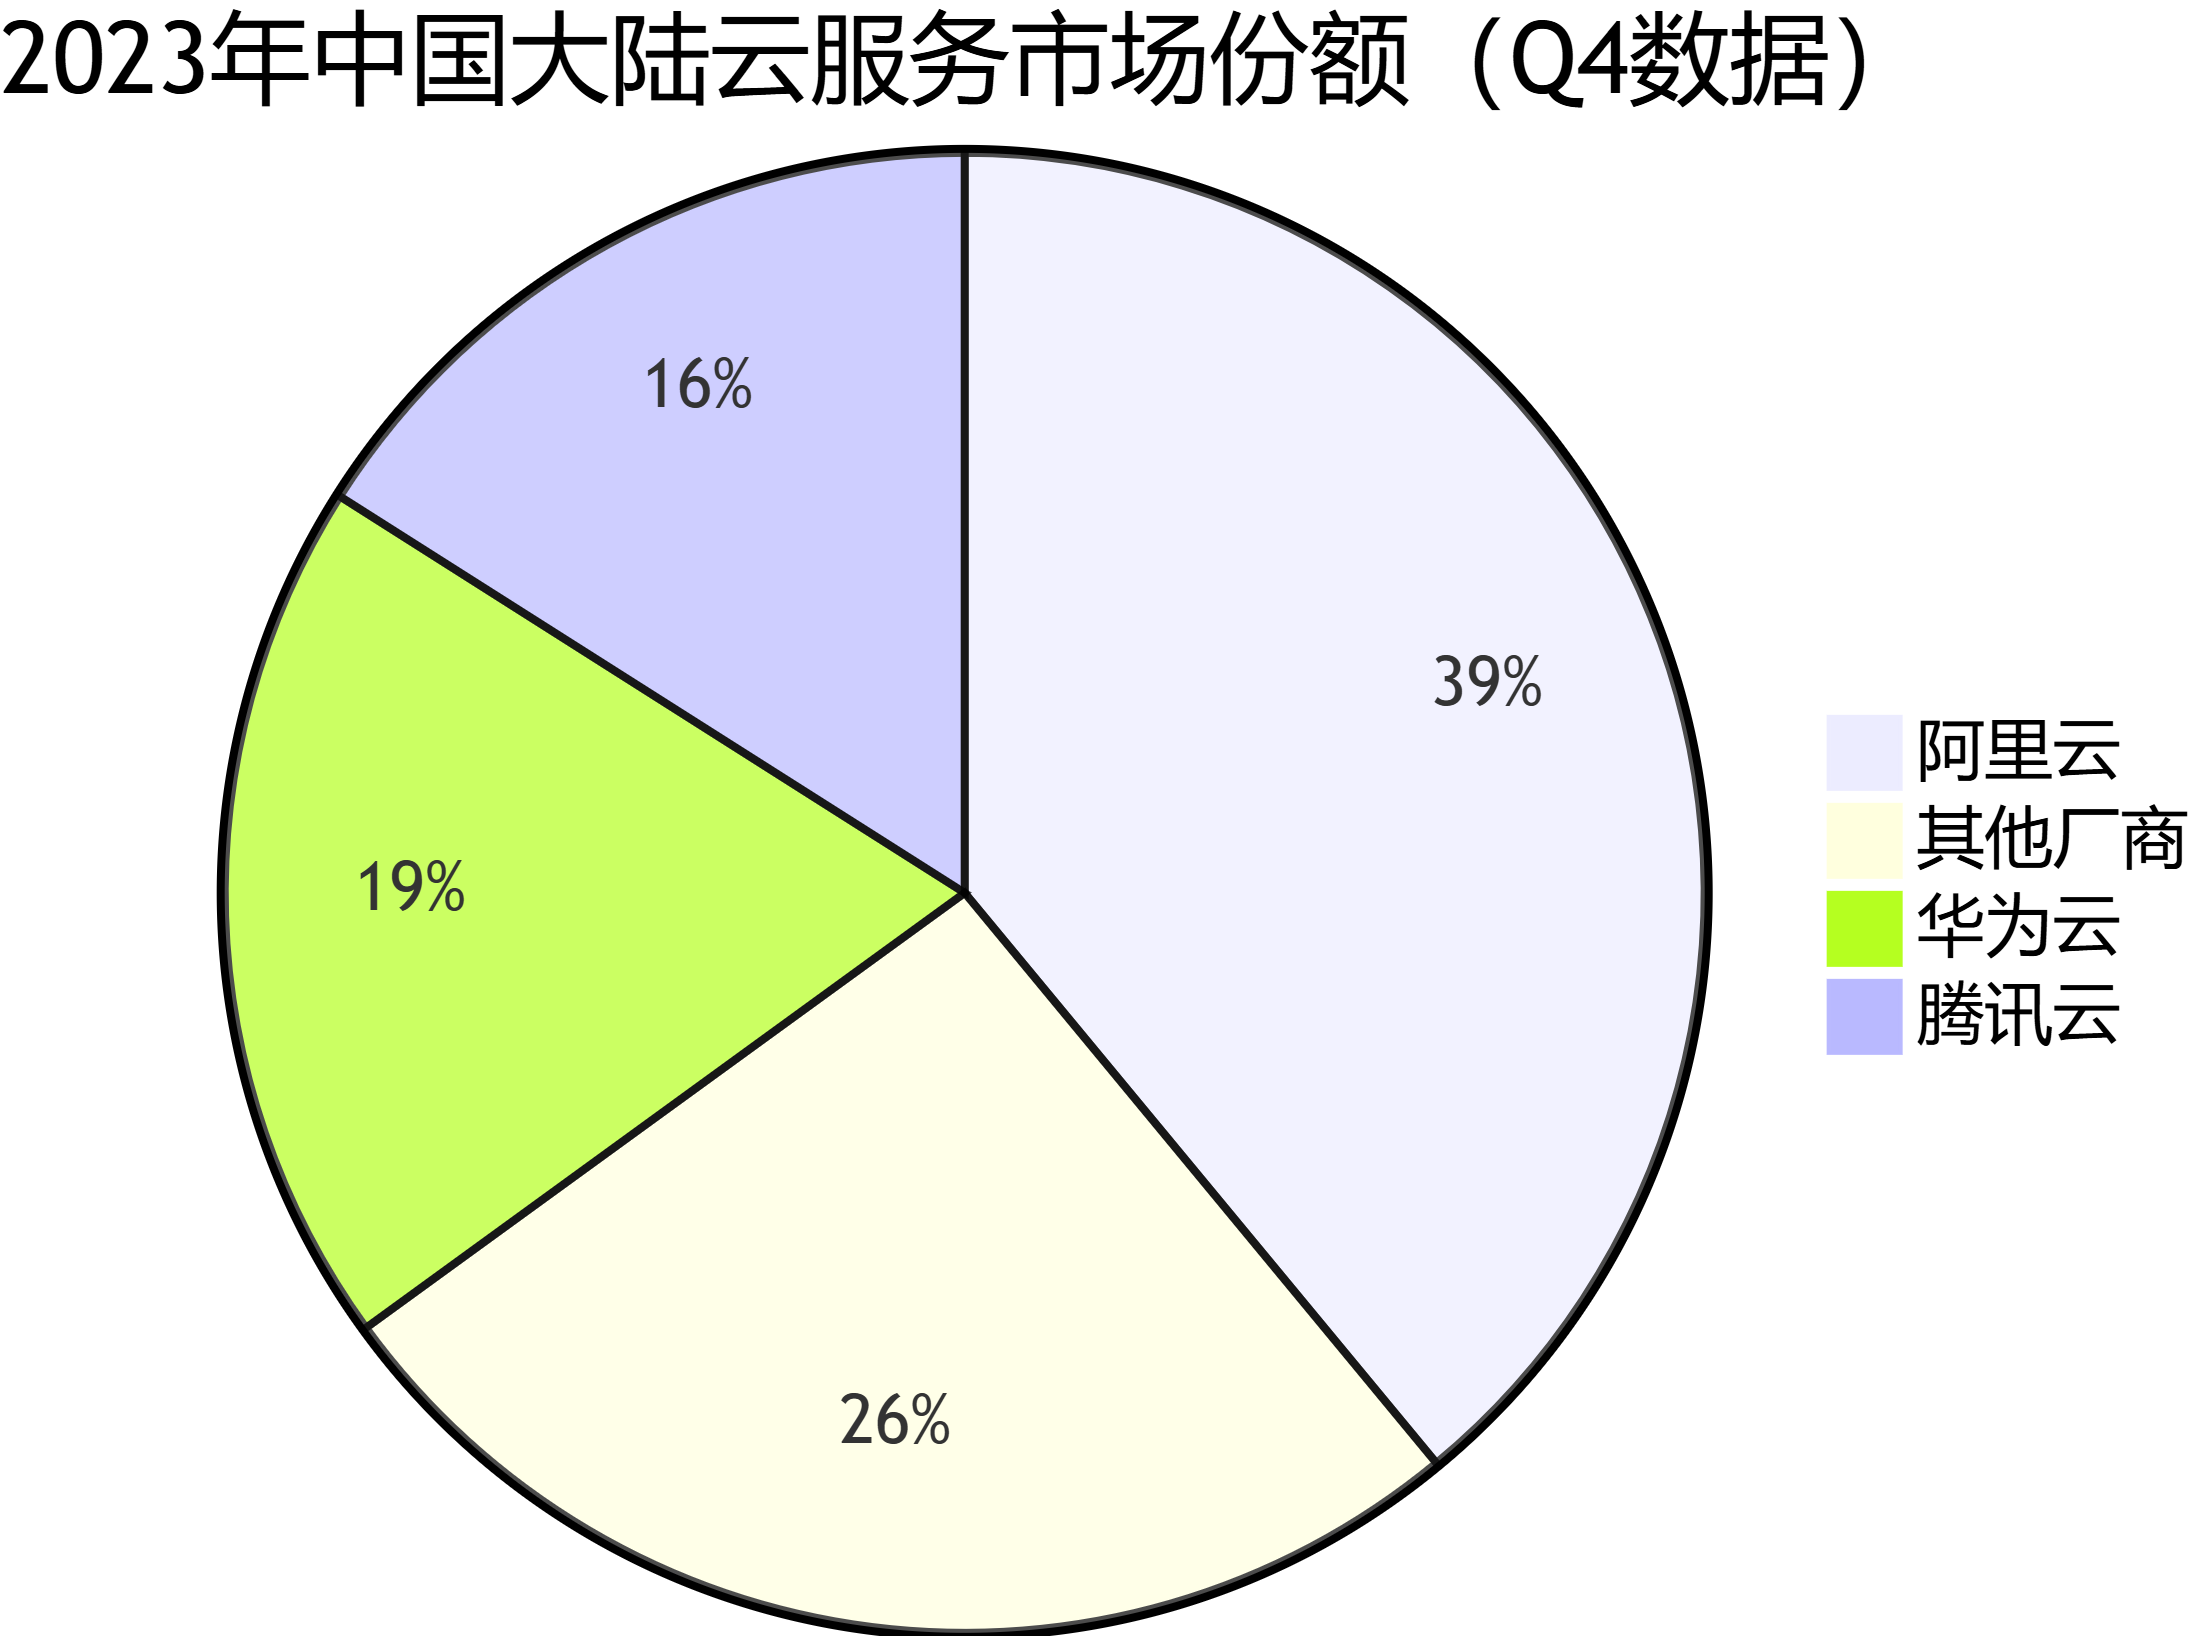
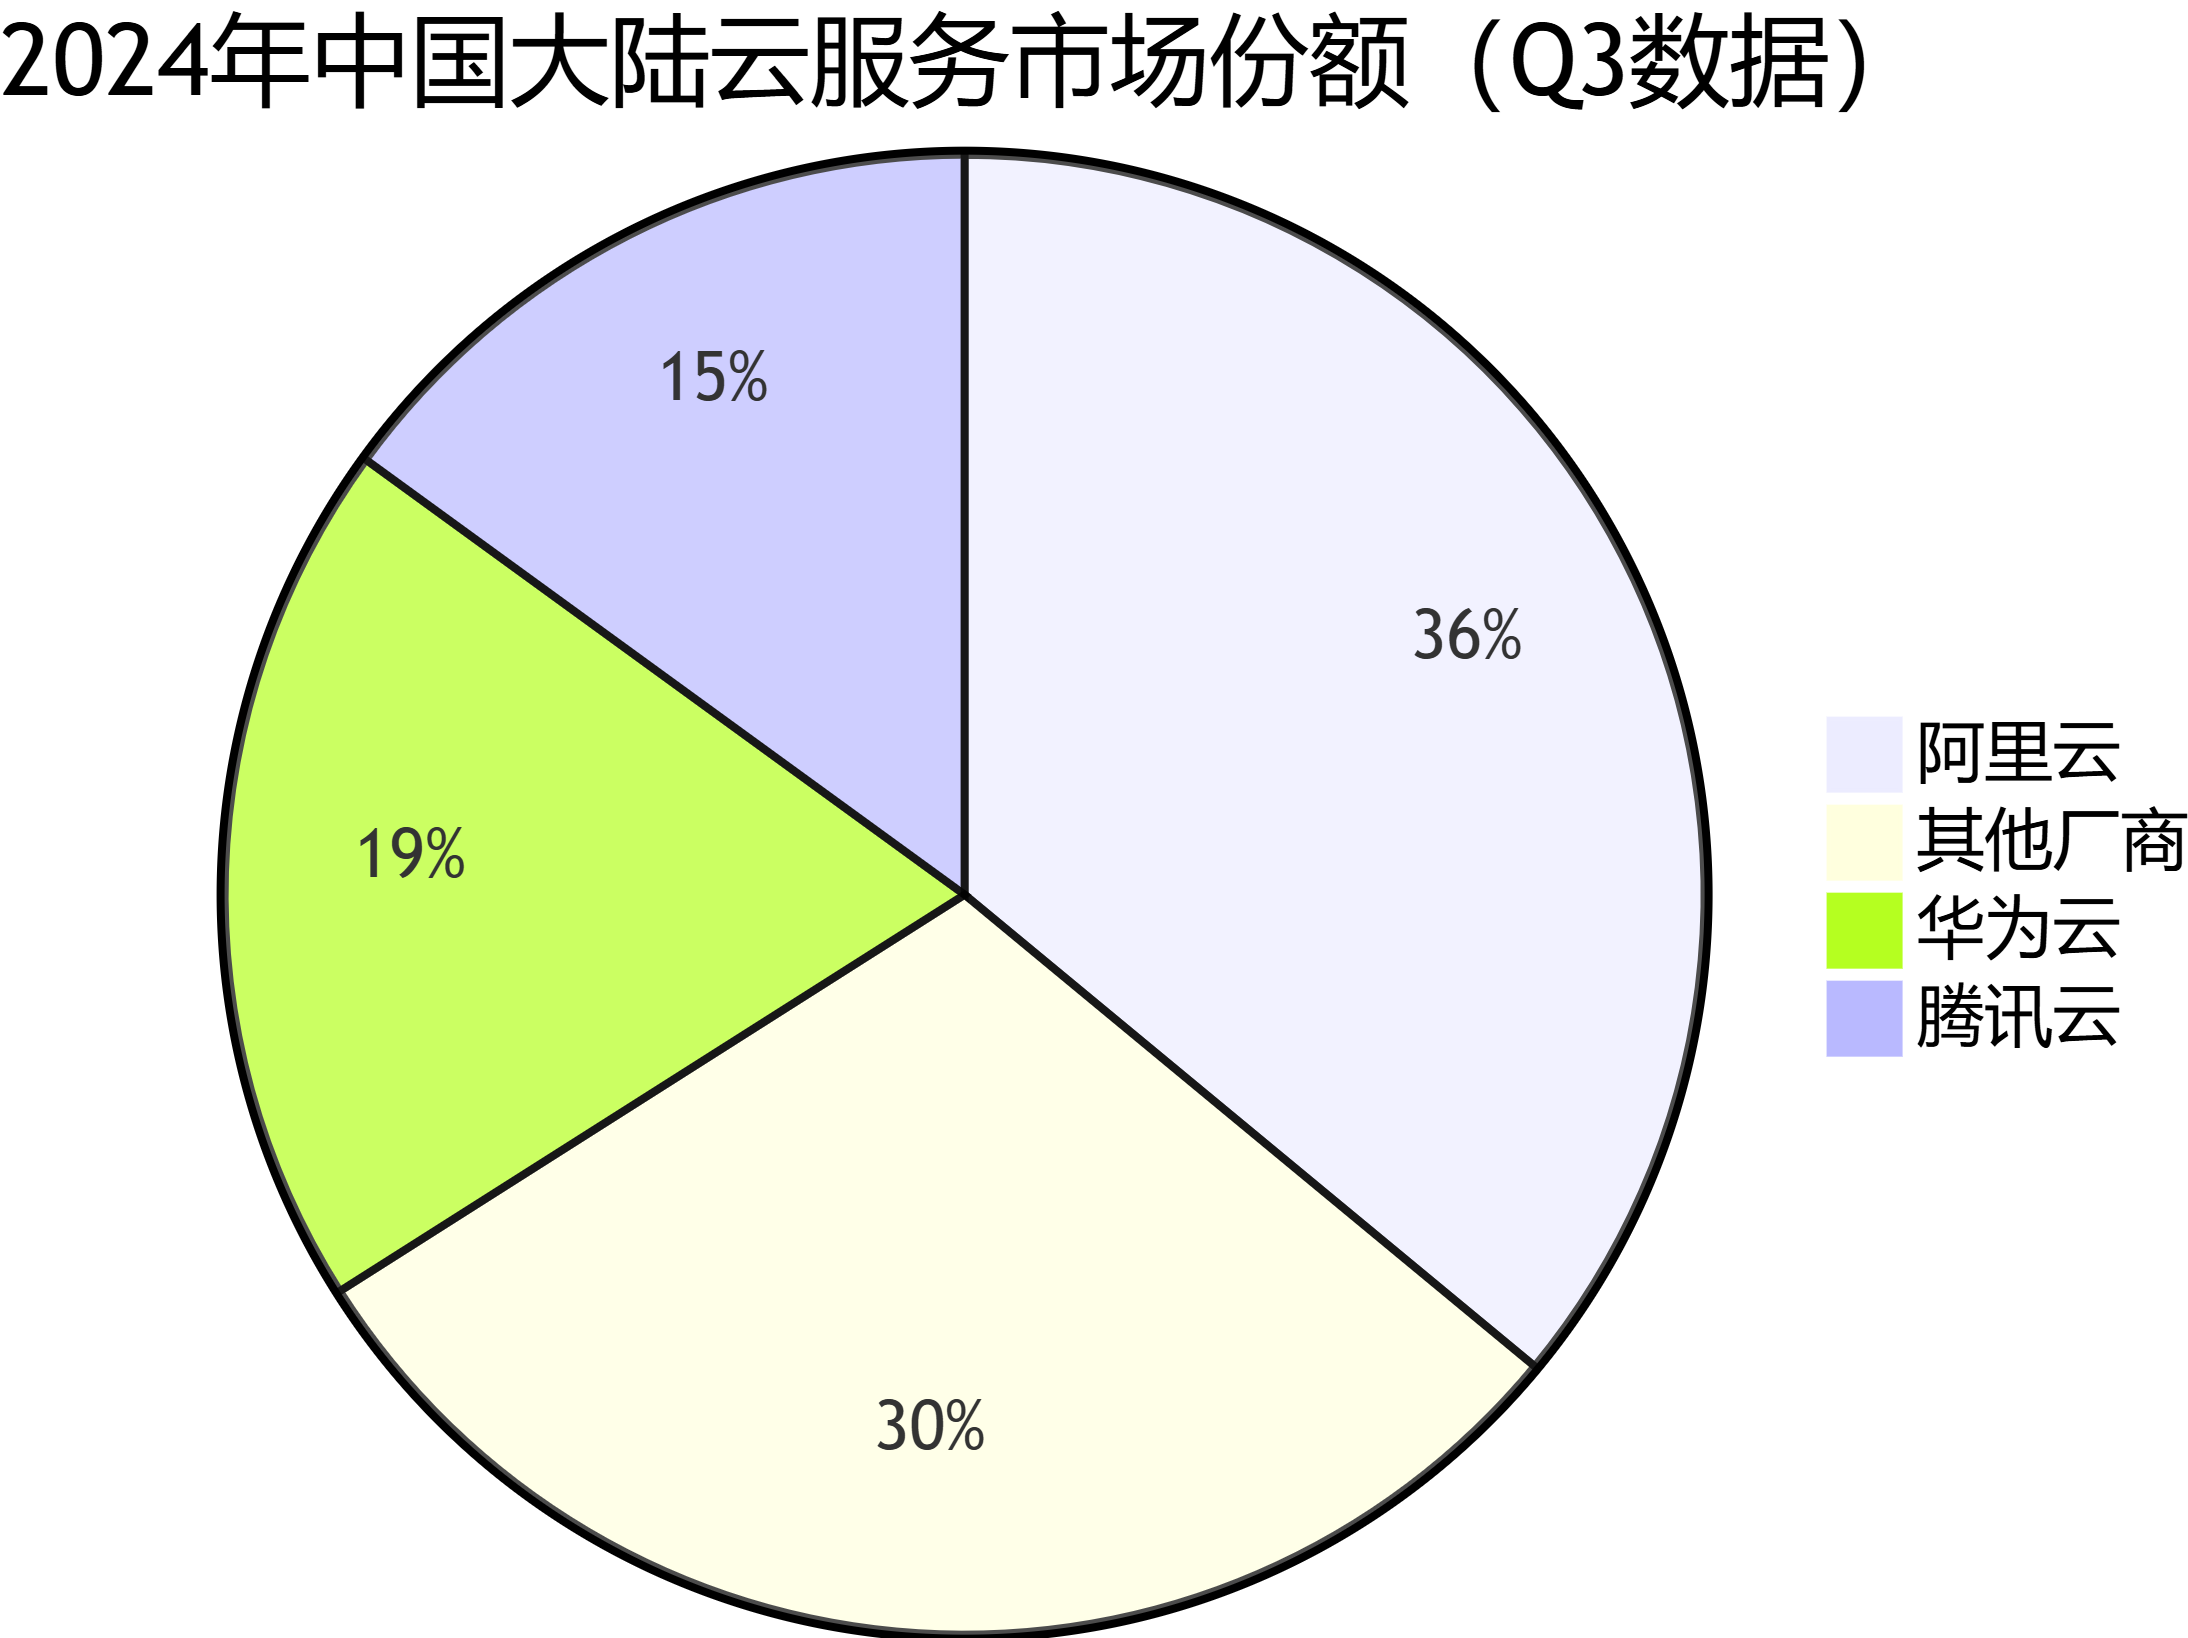
4. Enable both deep thinking and online search: Please use mermaid to draw the market share of cloud servers in 2023 and 2024.
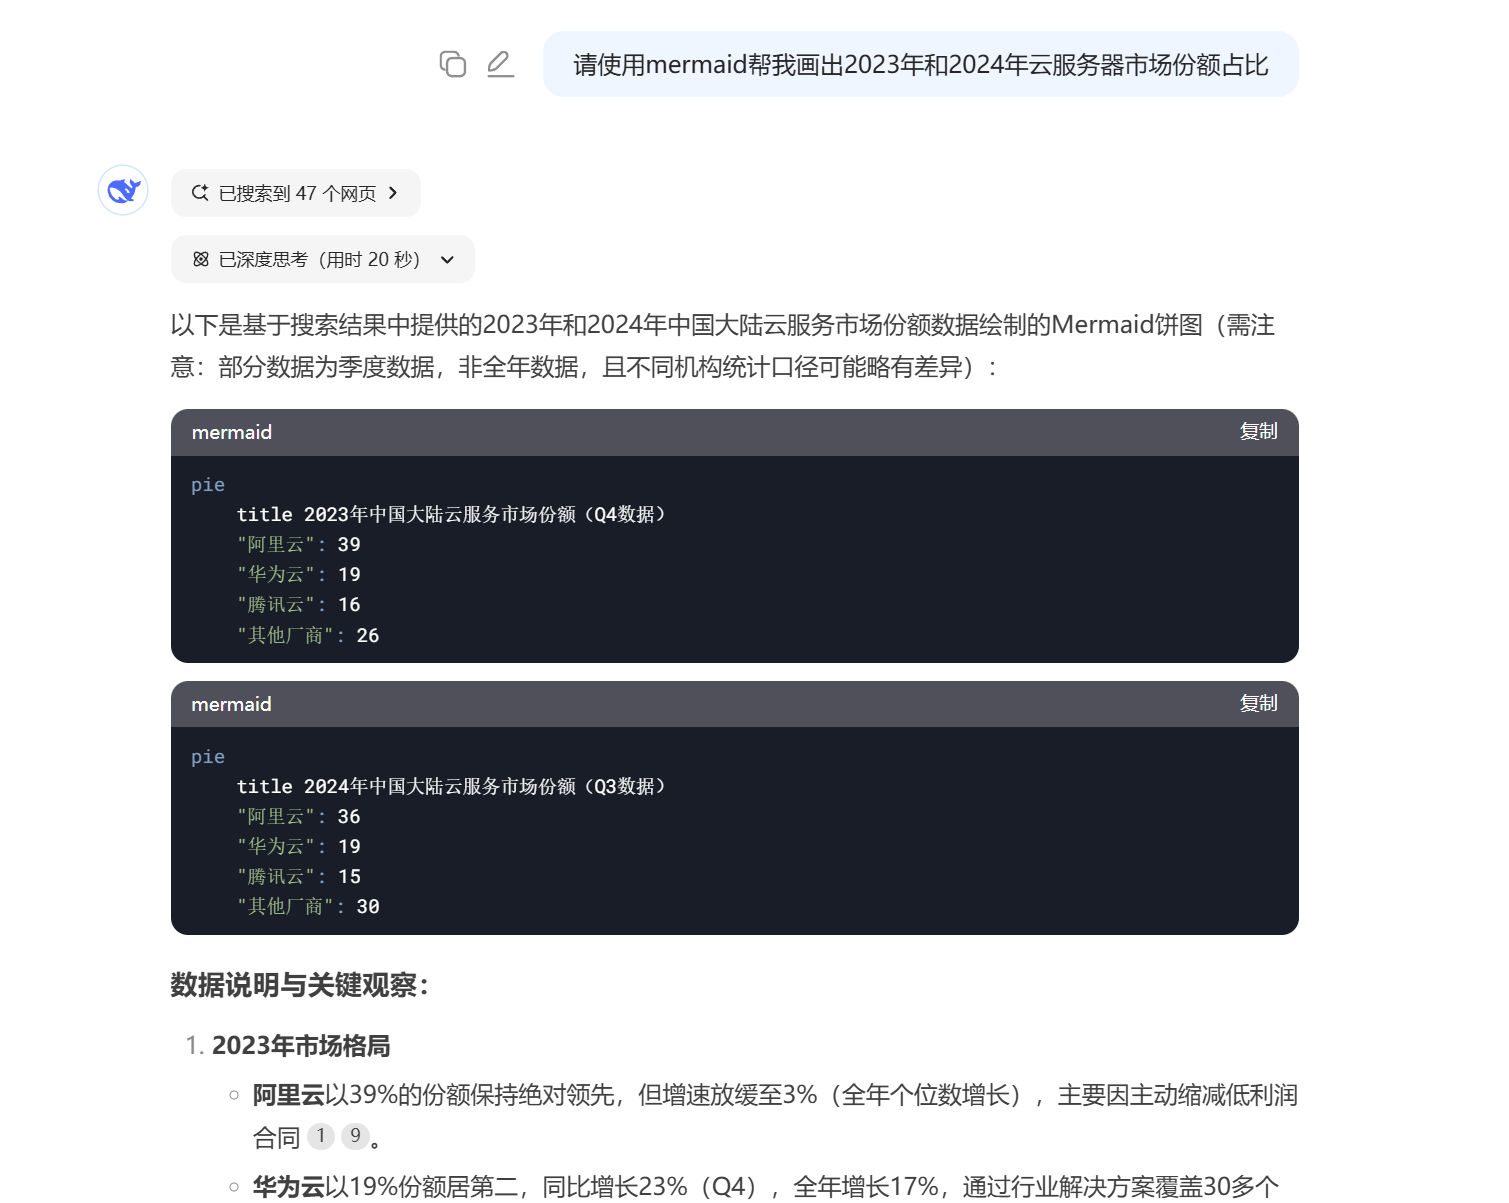
Thus, we obtain two pie charts.
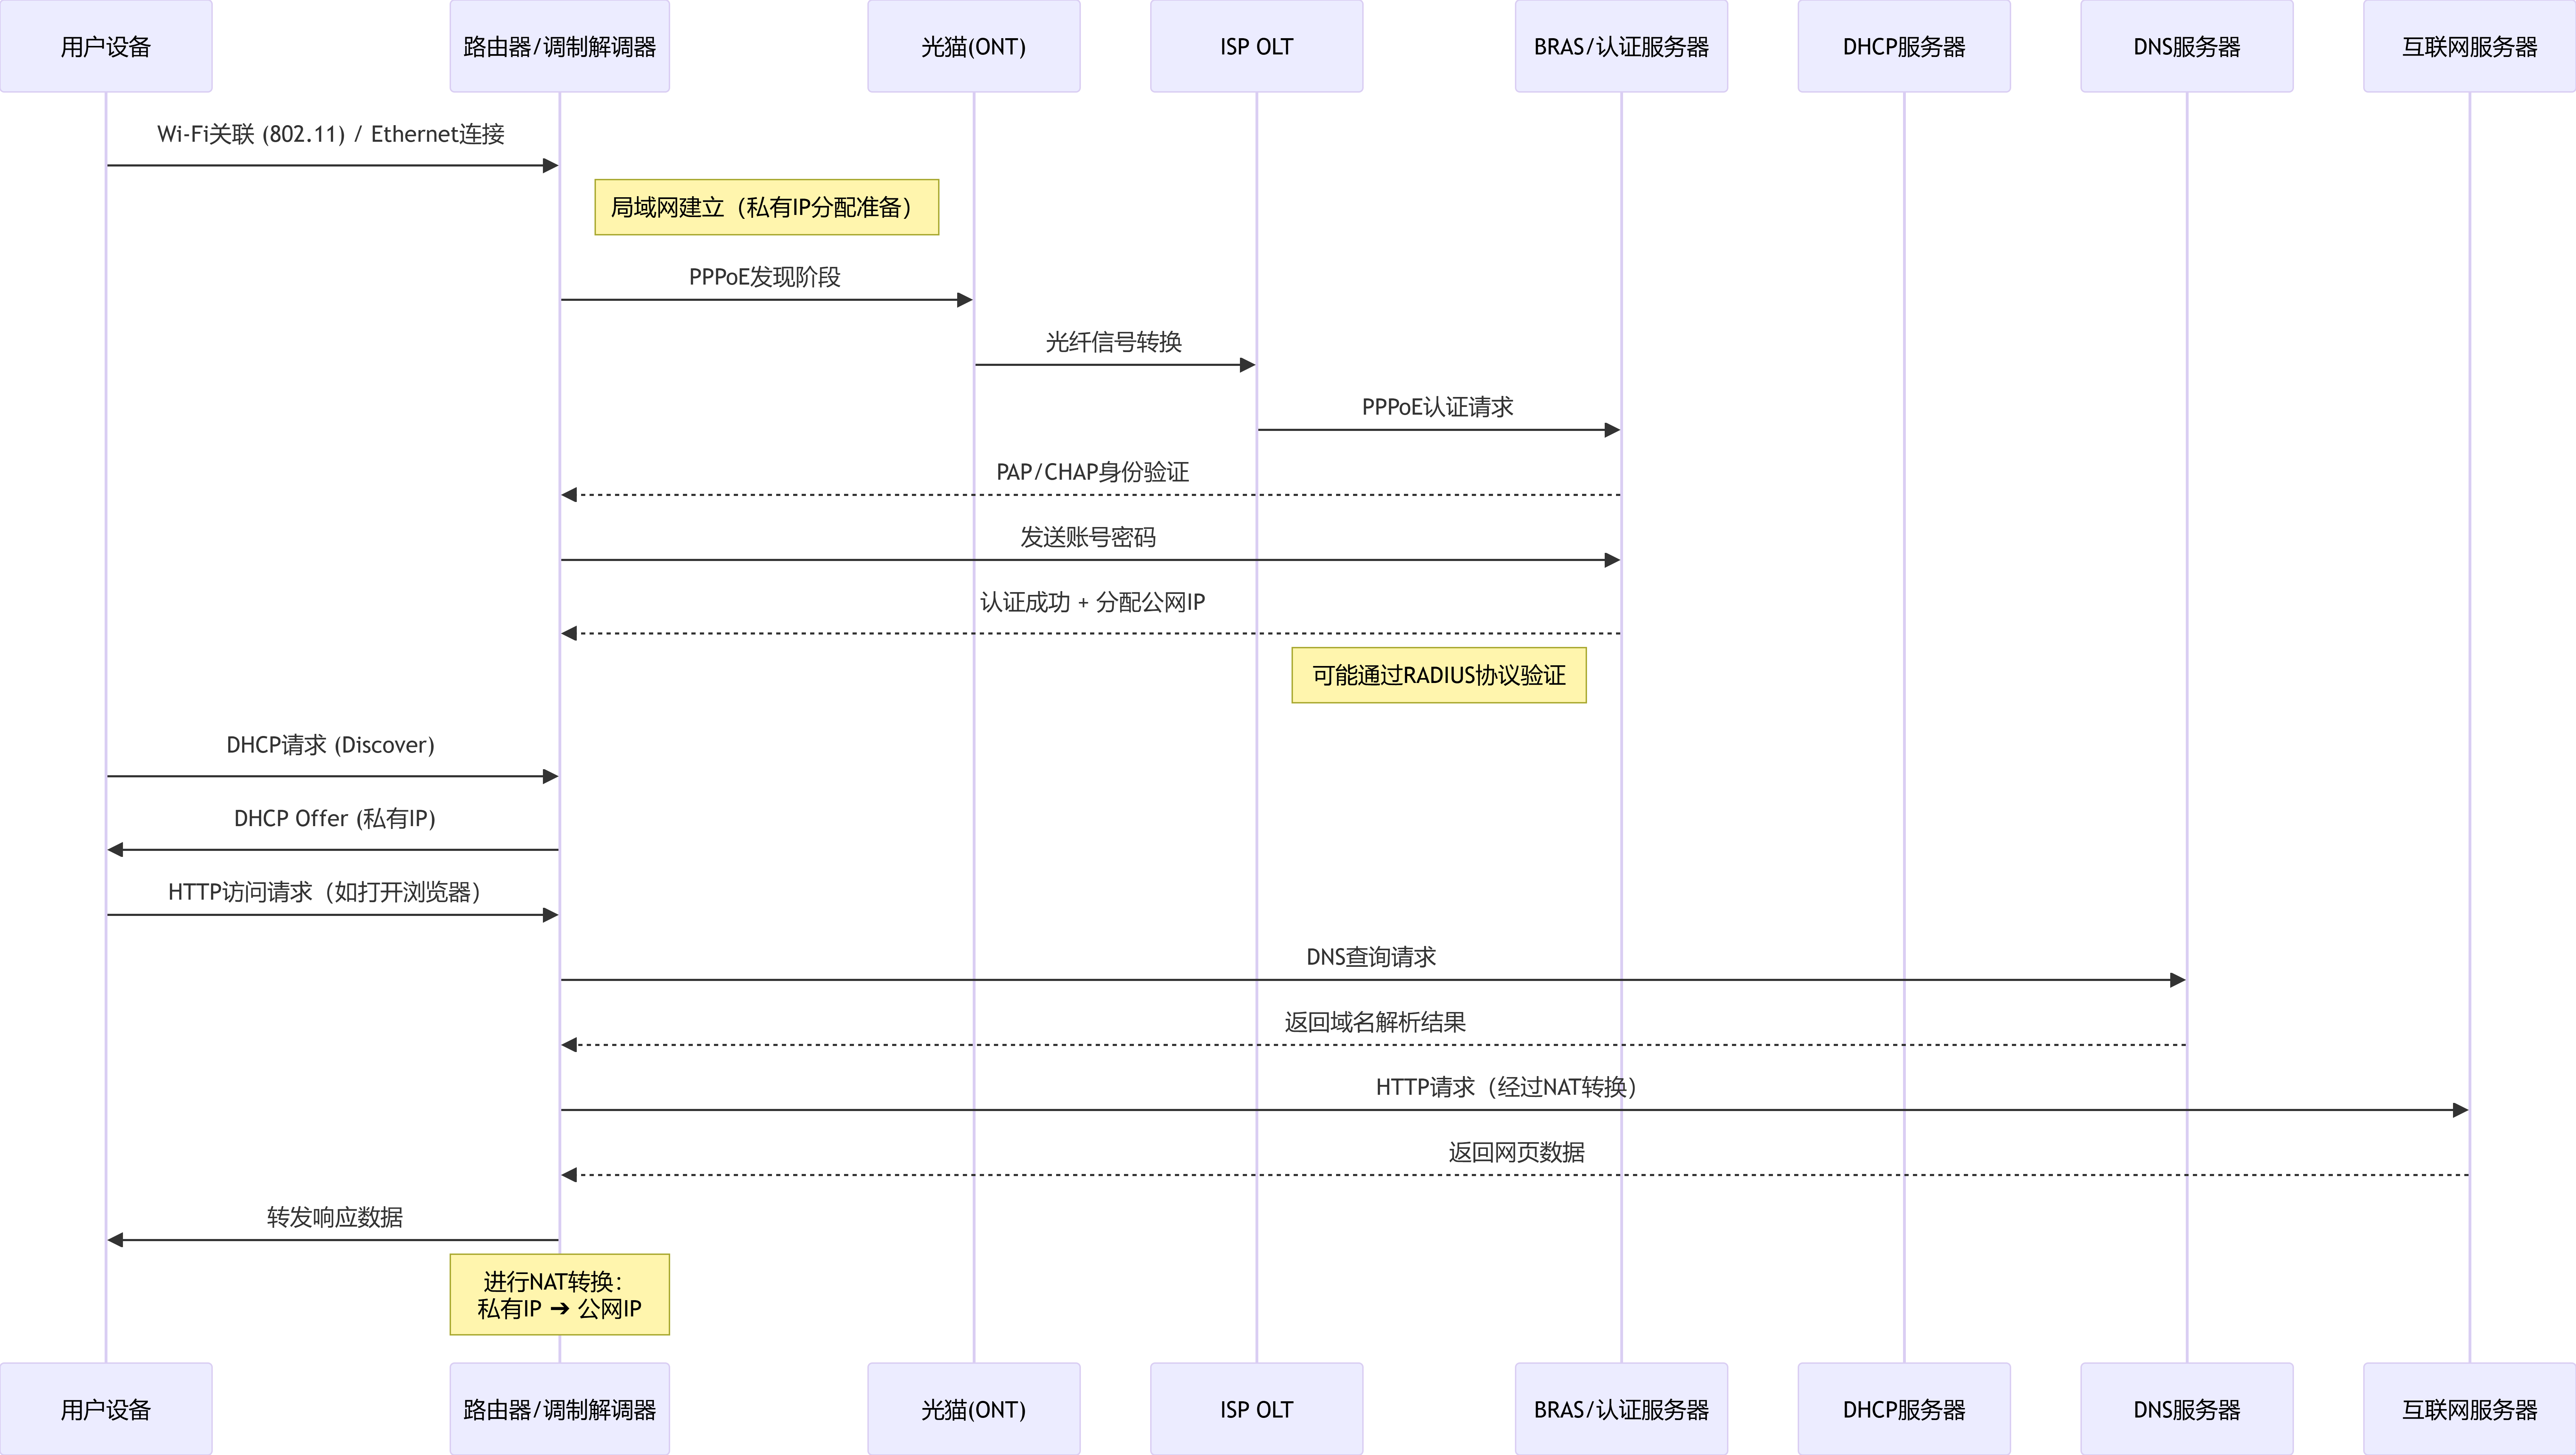
5. Please use mermaid to draw the protocol interaction diagram of a typical home broadband network.
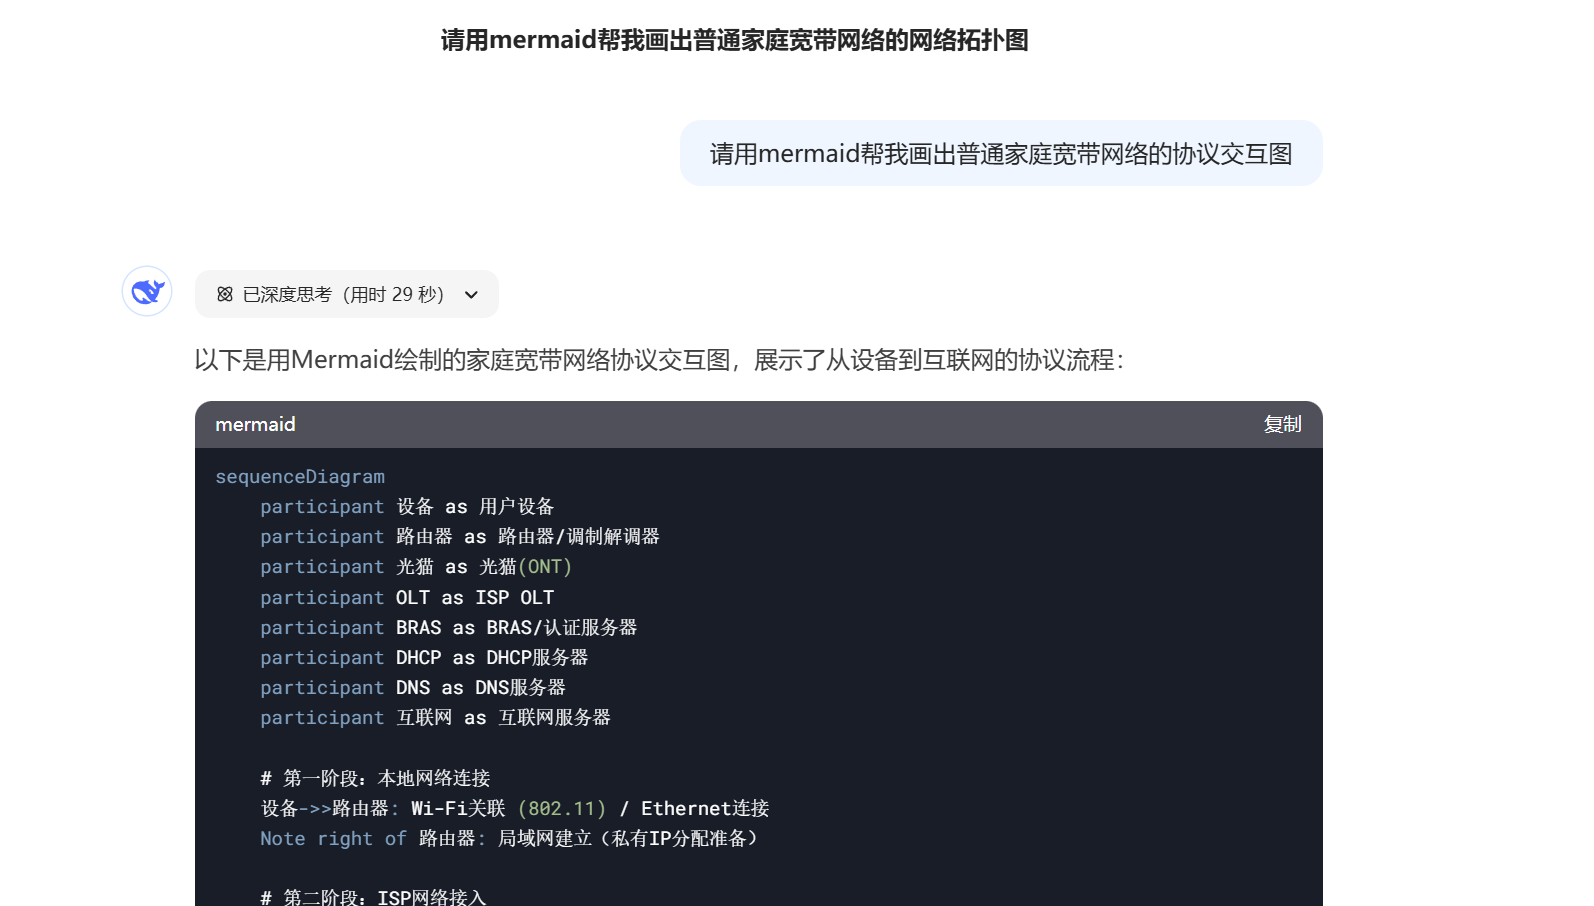
Thus, the chart is as follows:
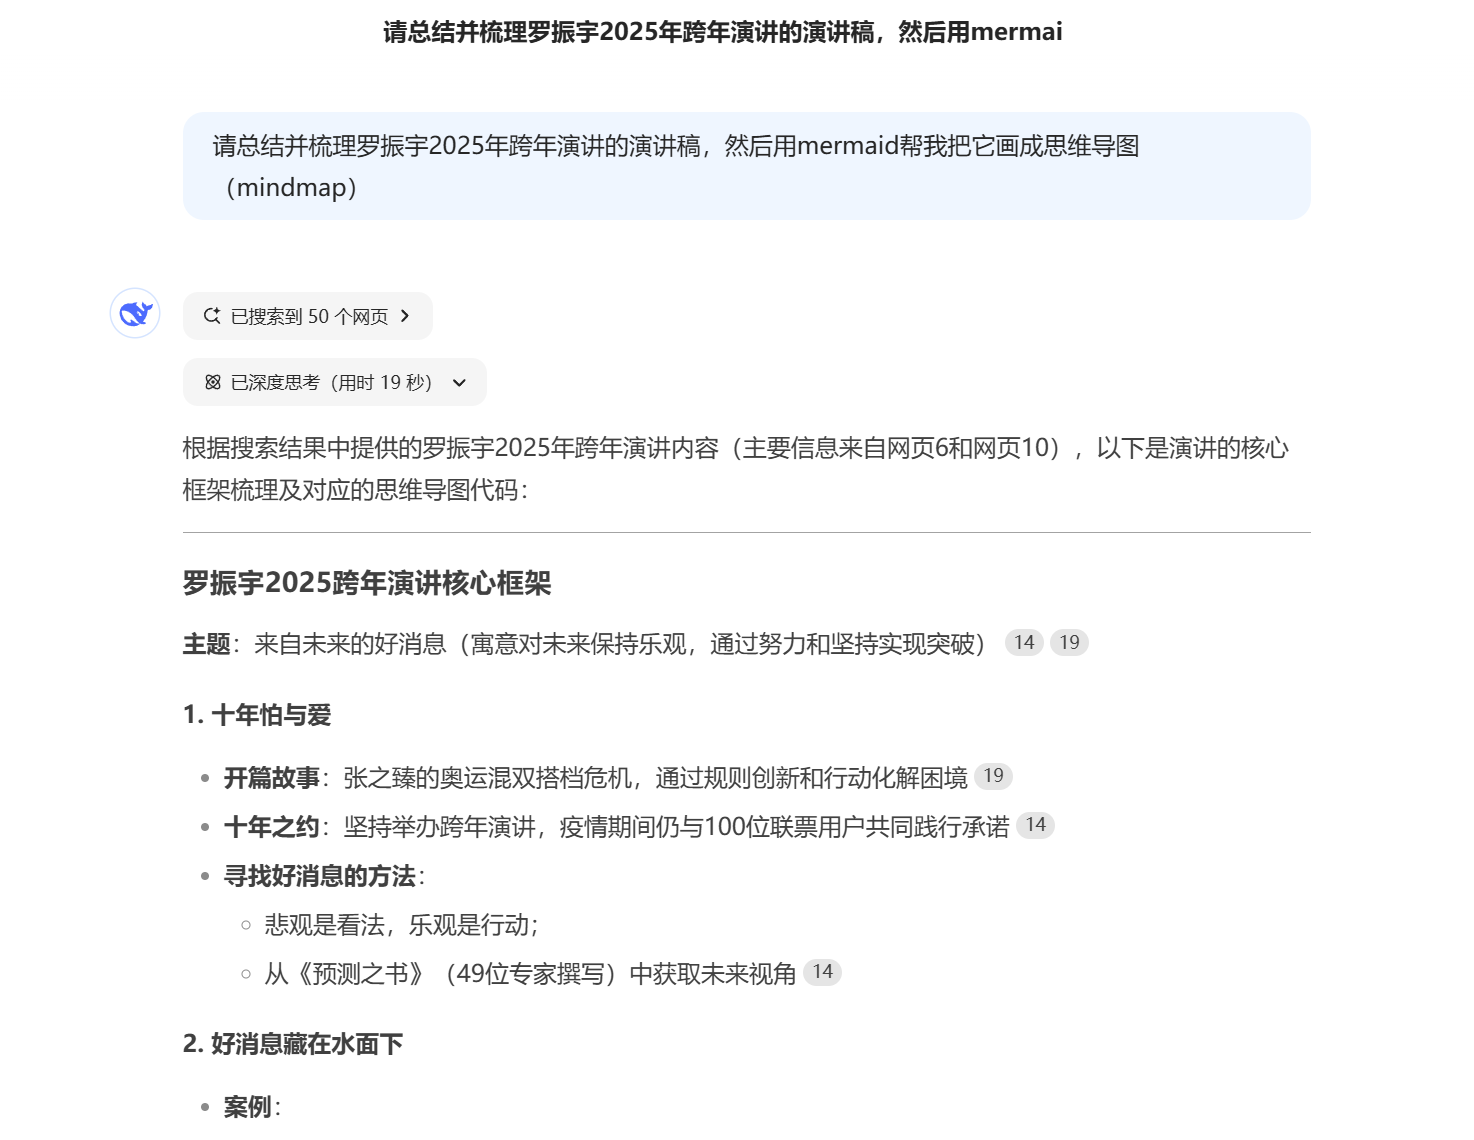
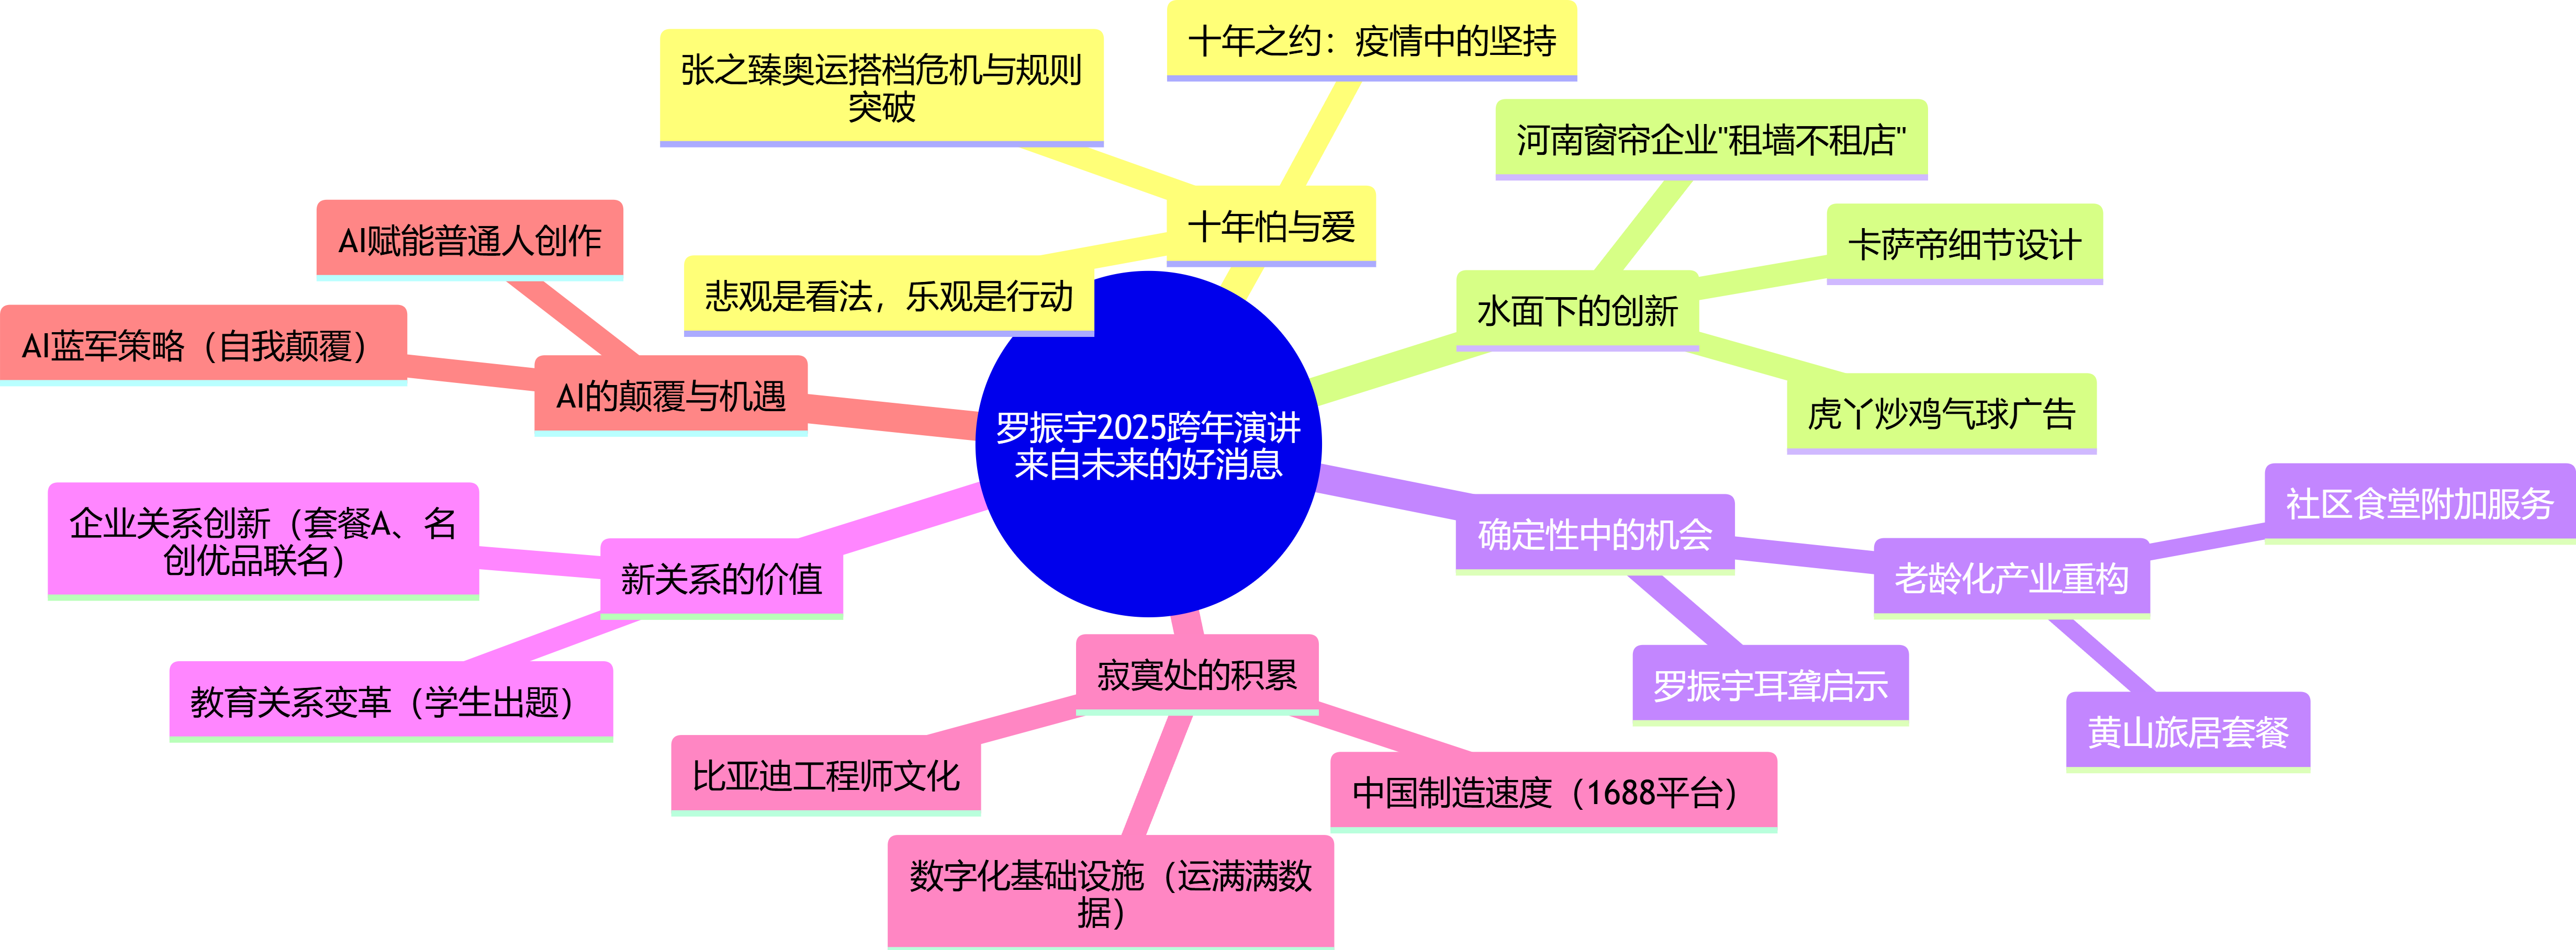
6. Enable both deep thinking and online search: Please summarize and organize the transcript of Luo Zhenyu’s 2025 New Year’s Eve speech, then use mermaid to draw it as a mind map.
*Here, DeepSeek has a bit of difficulty and needs a prompt to use mindmap for drawing a mind map; otherwise, it will draw the kind of flowchart-style mind map seen in the first example.
Thus, we obtain a mind map.
7. Enable both deep thinking and online search: Please use mermaid to draw the development history of the website acfun.
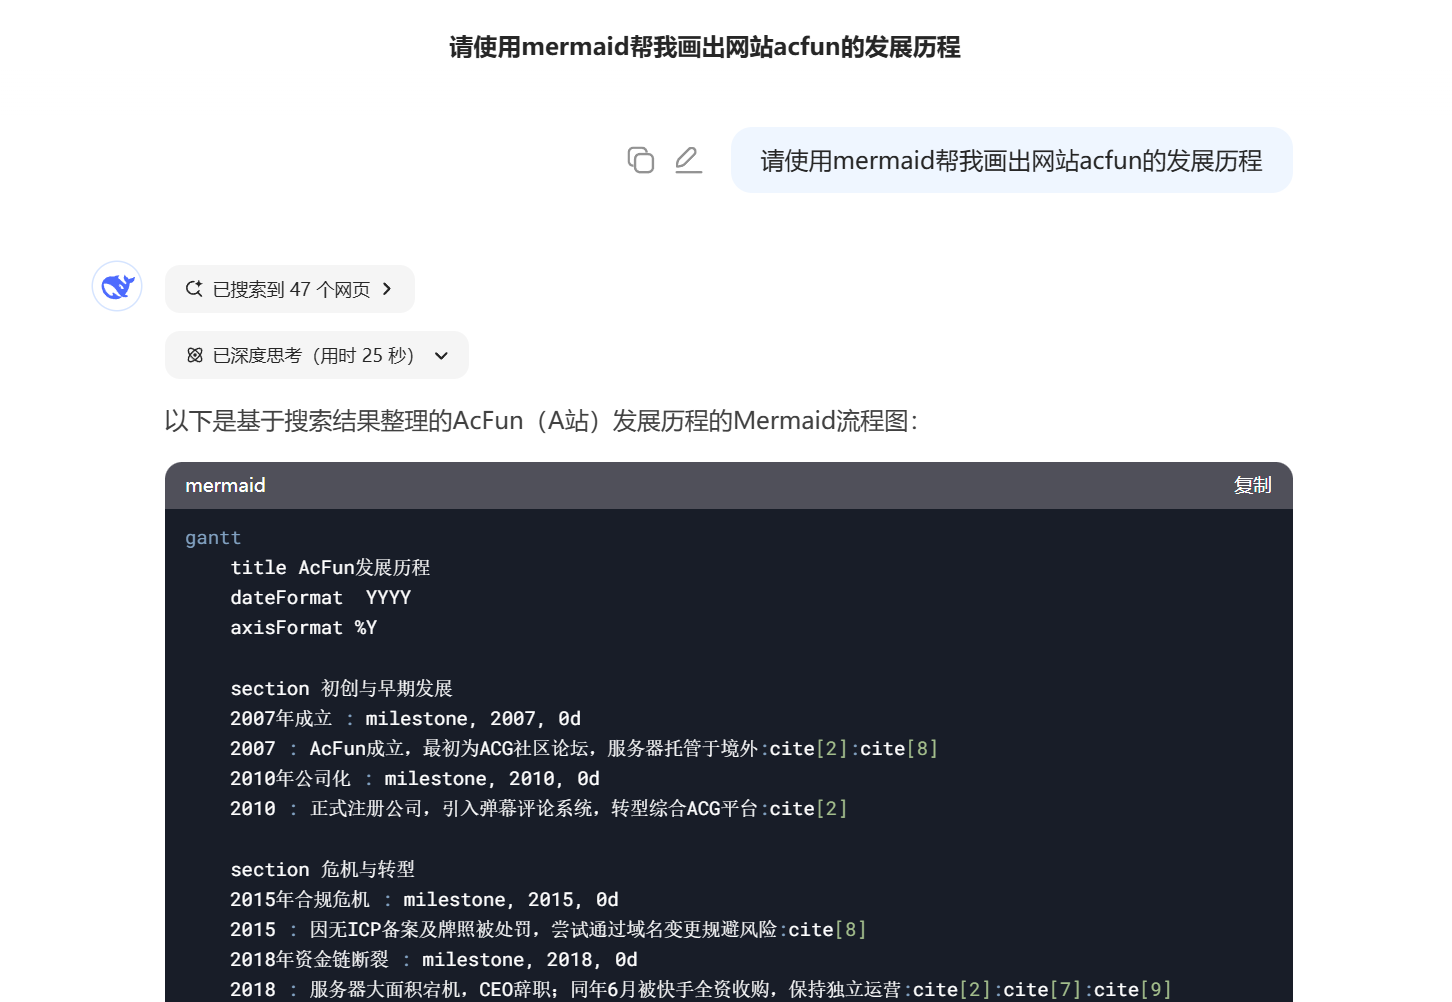
In this case, DeepSeek spontaneously used a Gantt chart, which is also reasonable.
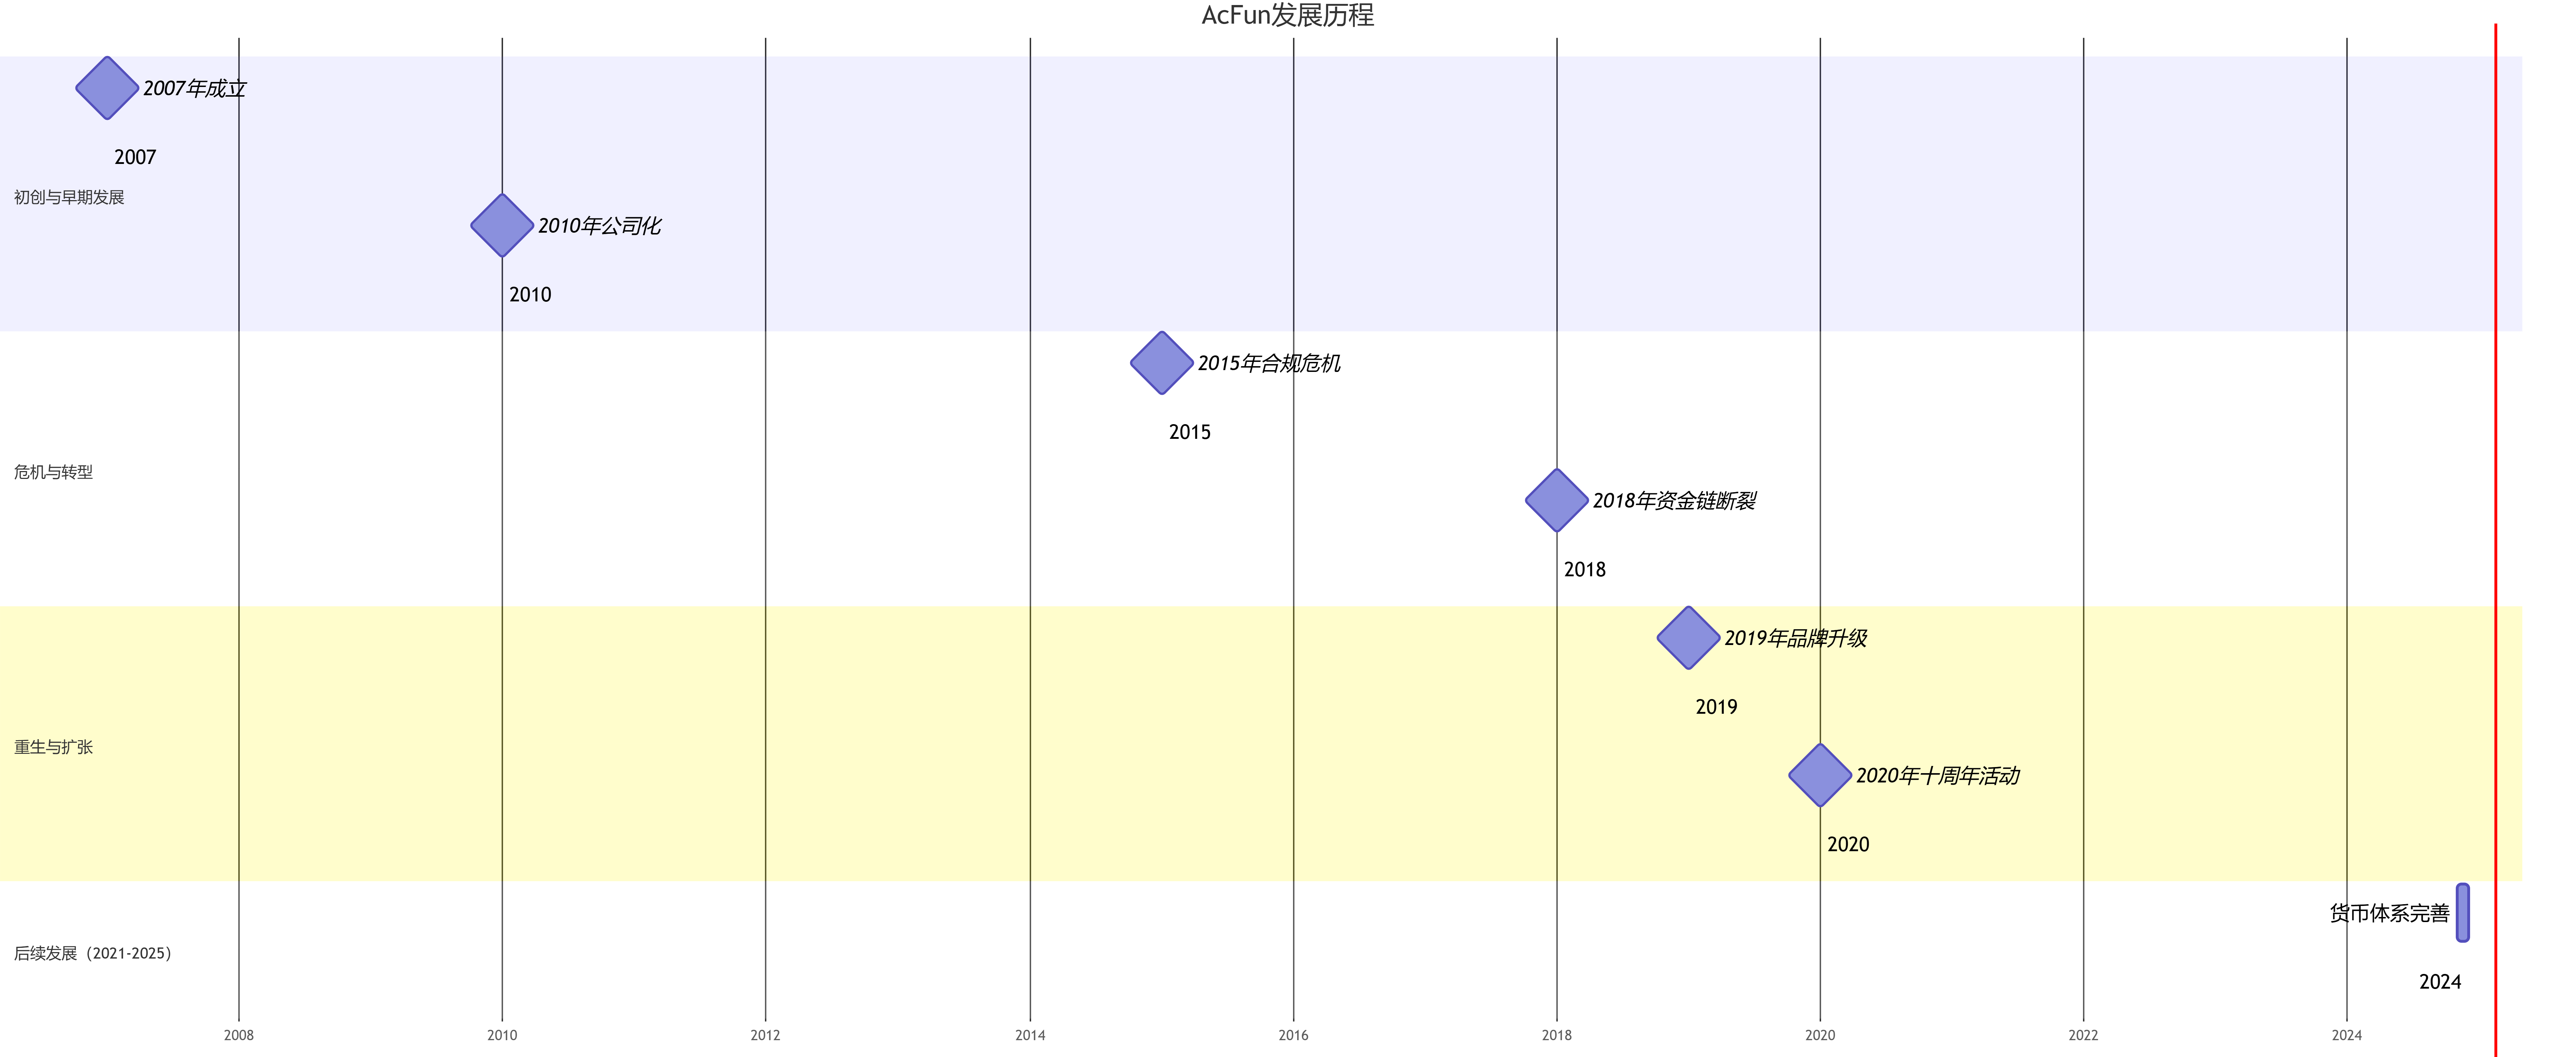
You can also explicitly request it to be drawn as a timeline.

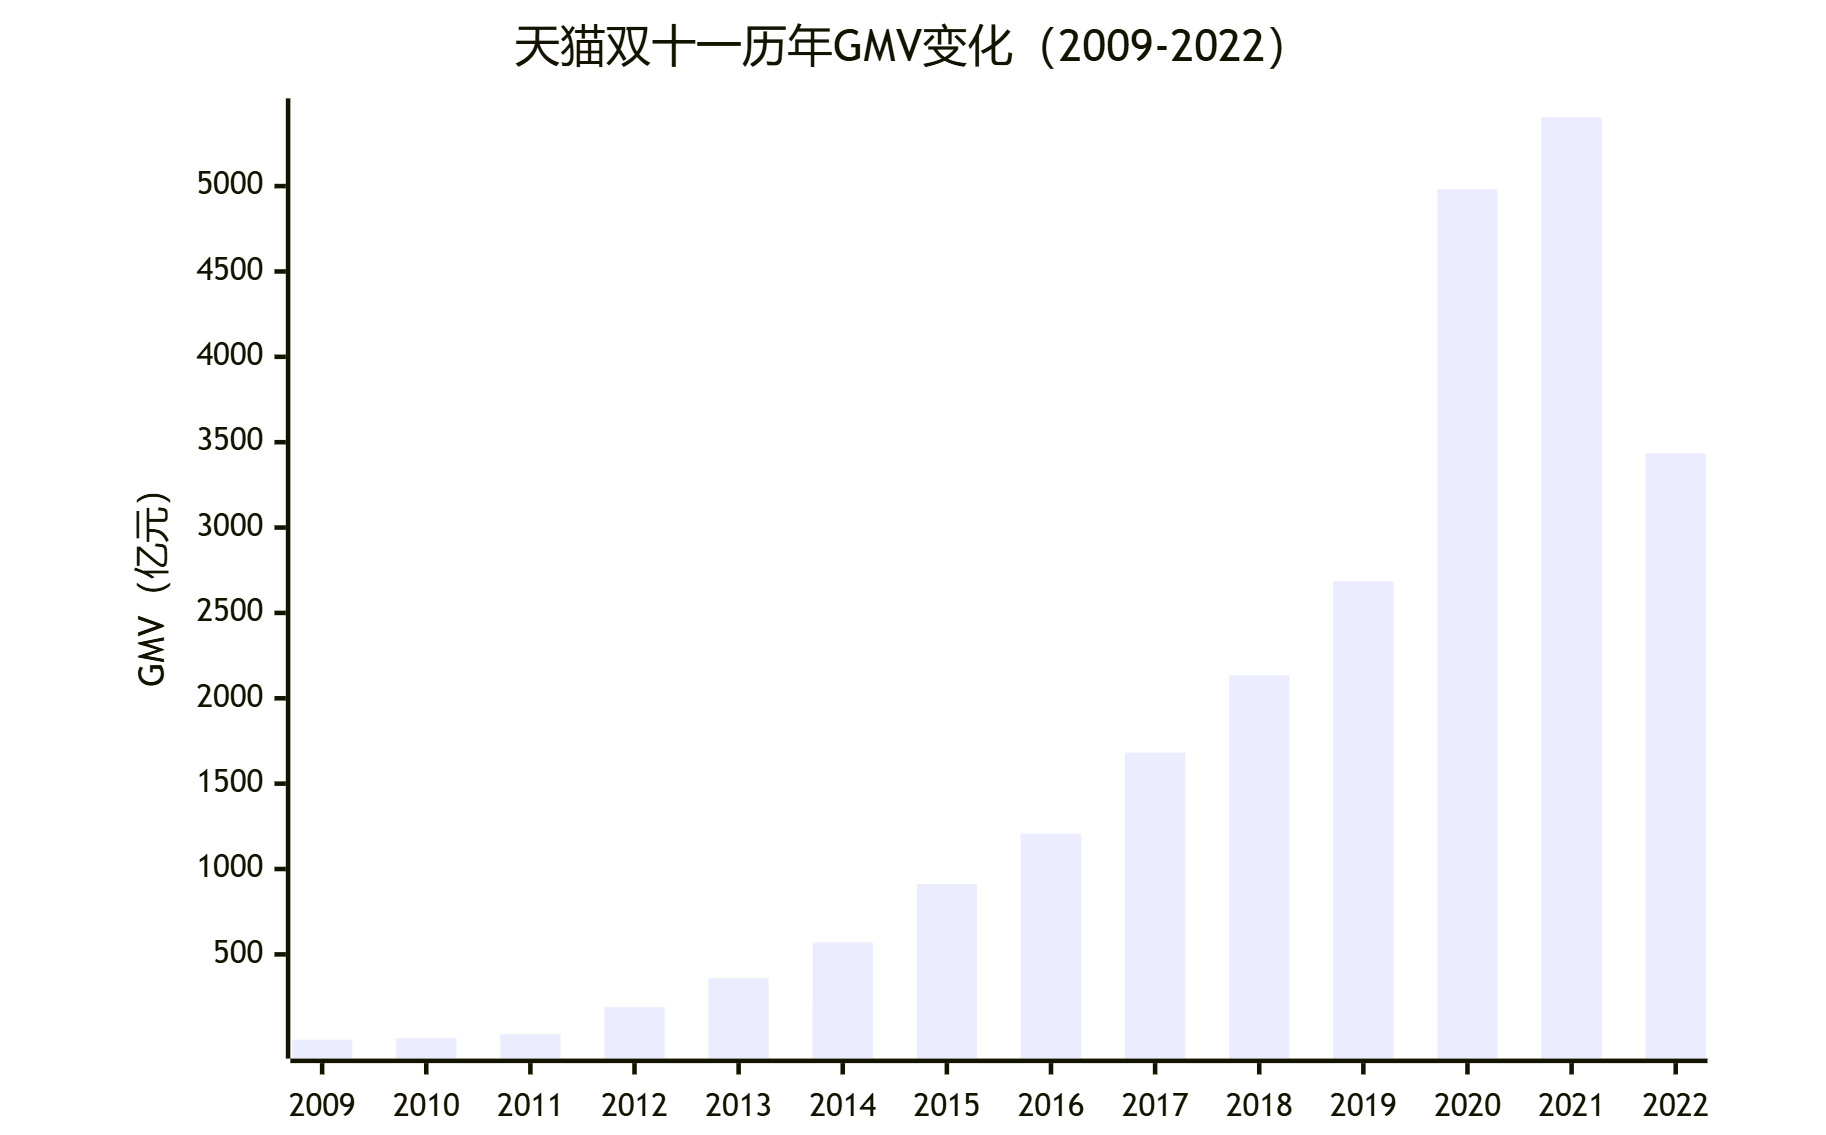
8. Simultaneously enable deep thinking and online search: Please use Mermaid to help me draw a bar chart (xychart) showing the changes in Tmall Double 11 GMV over the years.
*It should be noted here that DeepSeek needs to use the xychart diagram to correctly draw coordinate bar charts.
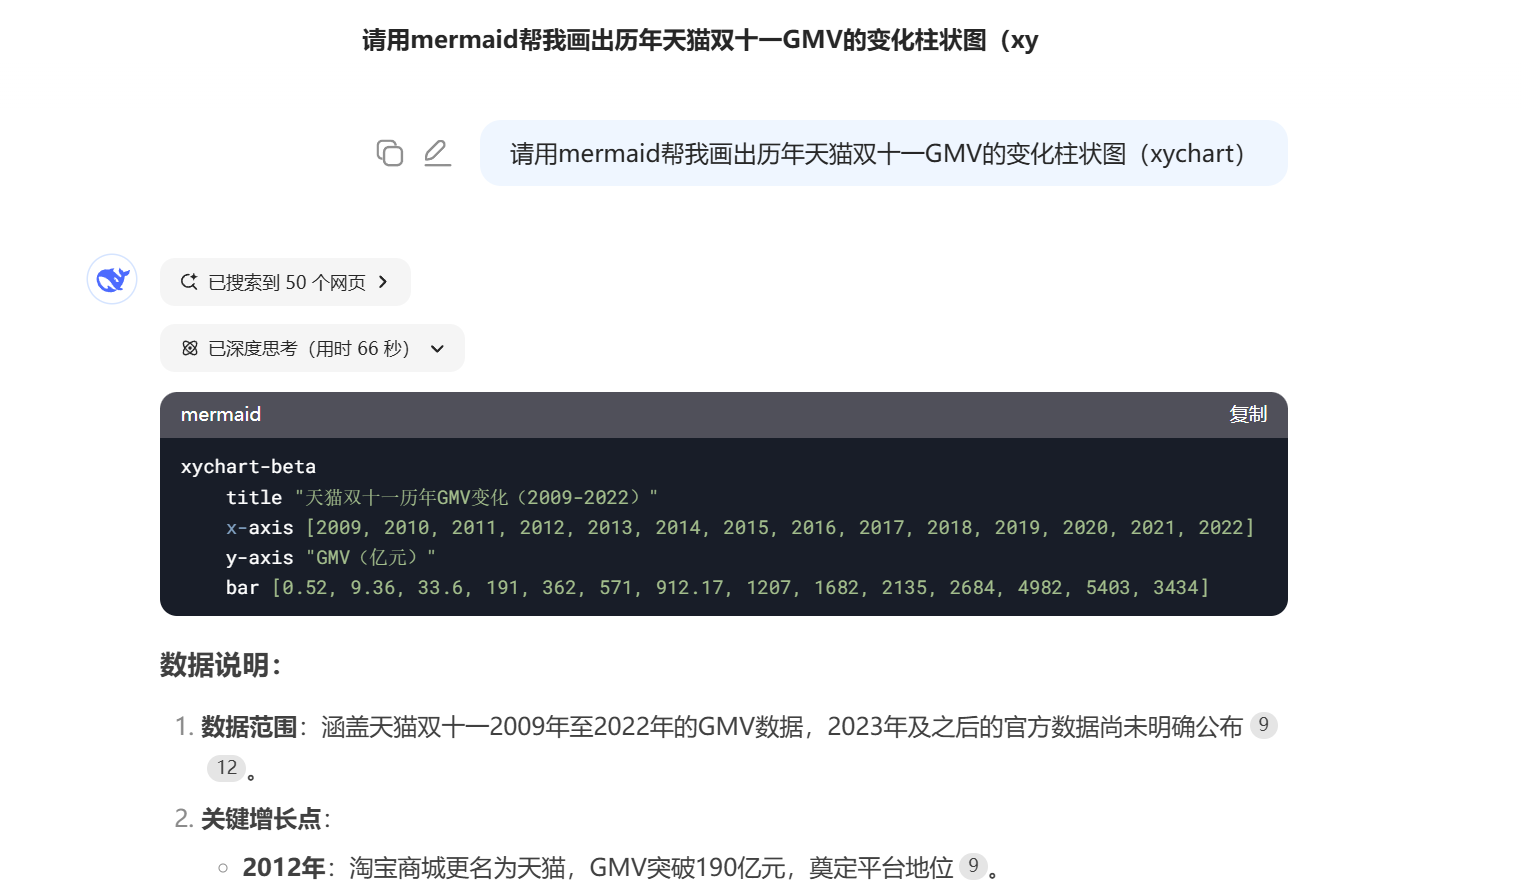
Then we get the bar chart:
The above demonstration cases basically cover the most common types of Mermaid diagrams, and I believe you have already understood them.
But I don’t want to stop here.
Previously, in:How can ordinary people use DeepSeek’s API?In this article, I expressed a viewpoint that I would like to reiterate here:
In the past, people who mastered some search skills, including myself, could benefit from small bonuses. Because we could always determine whether there might be some ready-made solutions for certain problems, and then through searching, find these existing solutions or small tools on the internet. Then, using these existing old wheels, we could quickly solve the new problems we encountered.
But with the advancement of AI, the optimal path to solving many problems may no longer be finding an existing good solution to the problem, but directly using AI to generate a 100% matching solution for the problem at hand and tackle it head-on.
This is also what I consider a new paradigm for problem-solving in the AI era.
Previously,In the article about Markdown,Many people left comments in the comment section, expressing confusion about why I recommended writing a new converter to handle Markdown markup.
Some said such symbols can be deleted one by one manually without much effort; some said to use Find and Replace in Word; some said to use Tencent Docs; some said to find an open-source Markdown editor online and convert it to PDF; some chose to install VSCode and Typora to solve it; some said Markdown itself allows humans to read it directly, so there’s no need to convert; and some said they would just give up on formatting and require in the prompt not to use Markdown.
But I still recommend using AI to generate a personal converter that best suits your own habits. This is not only for private customization but also for deliberate practice.
Therefore, while mermaidchart.com and mermaid.live are both quite good,
I still opened Cursor.
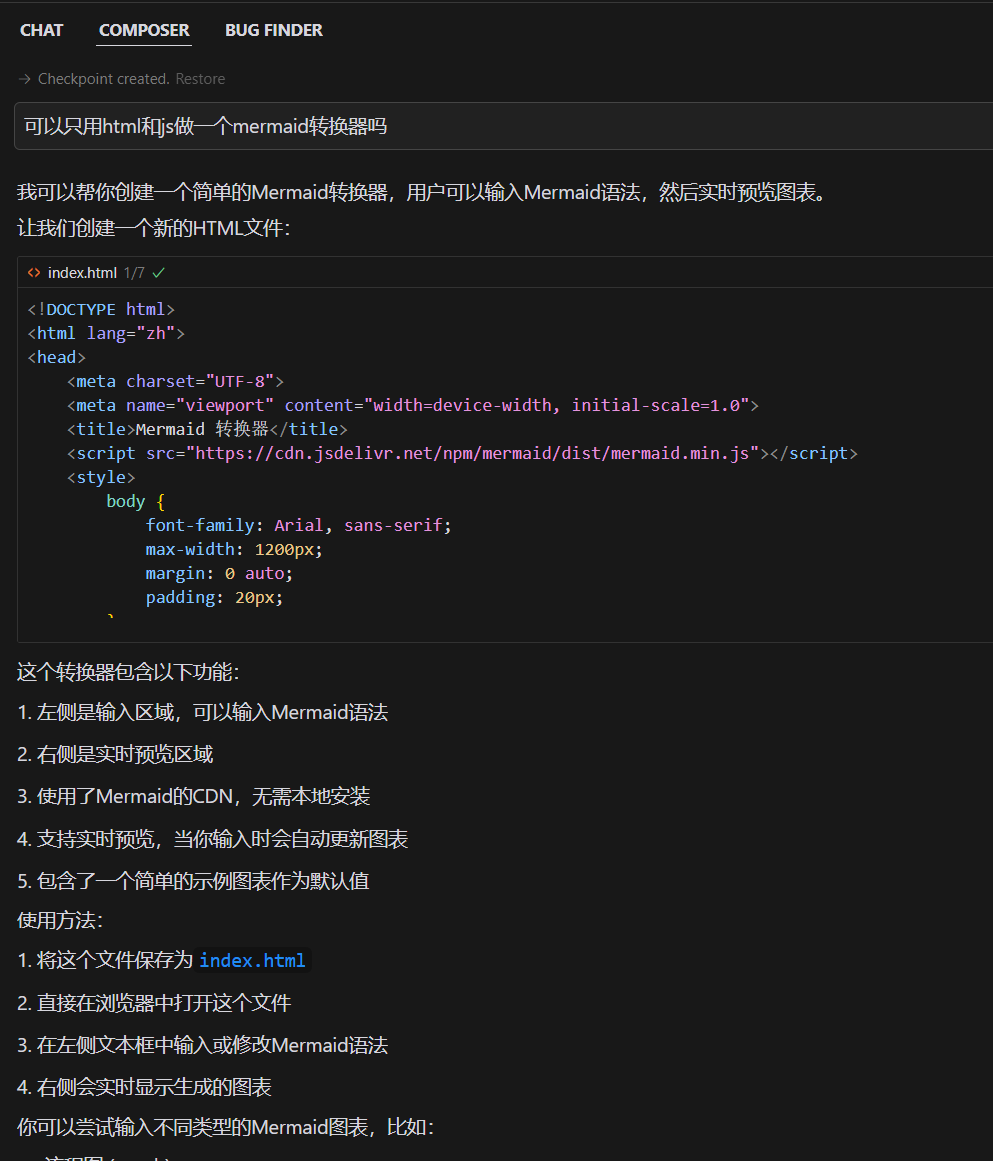
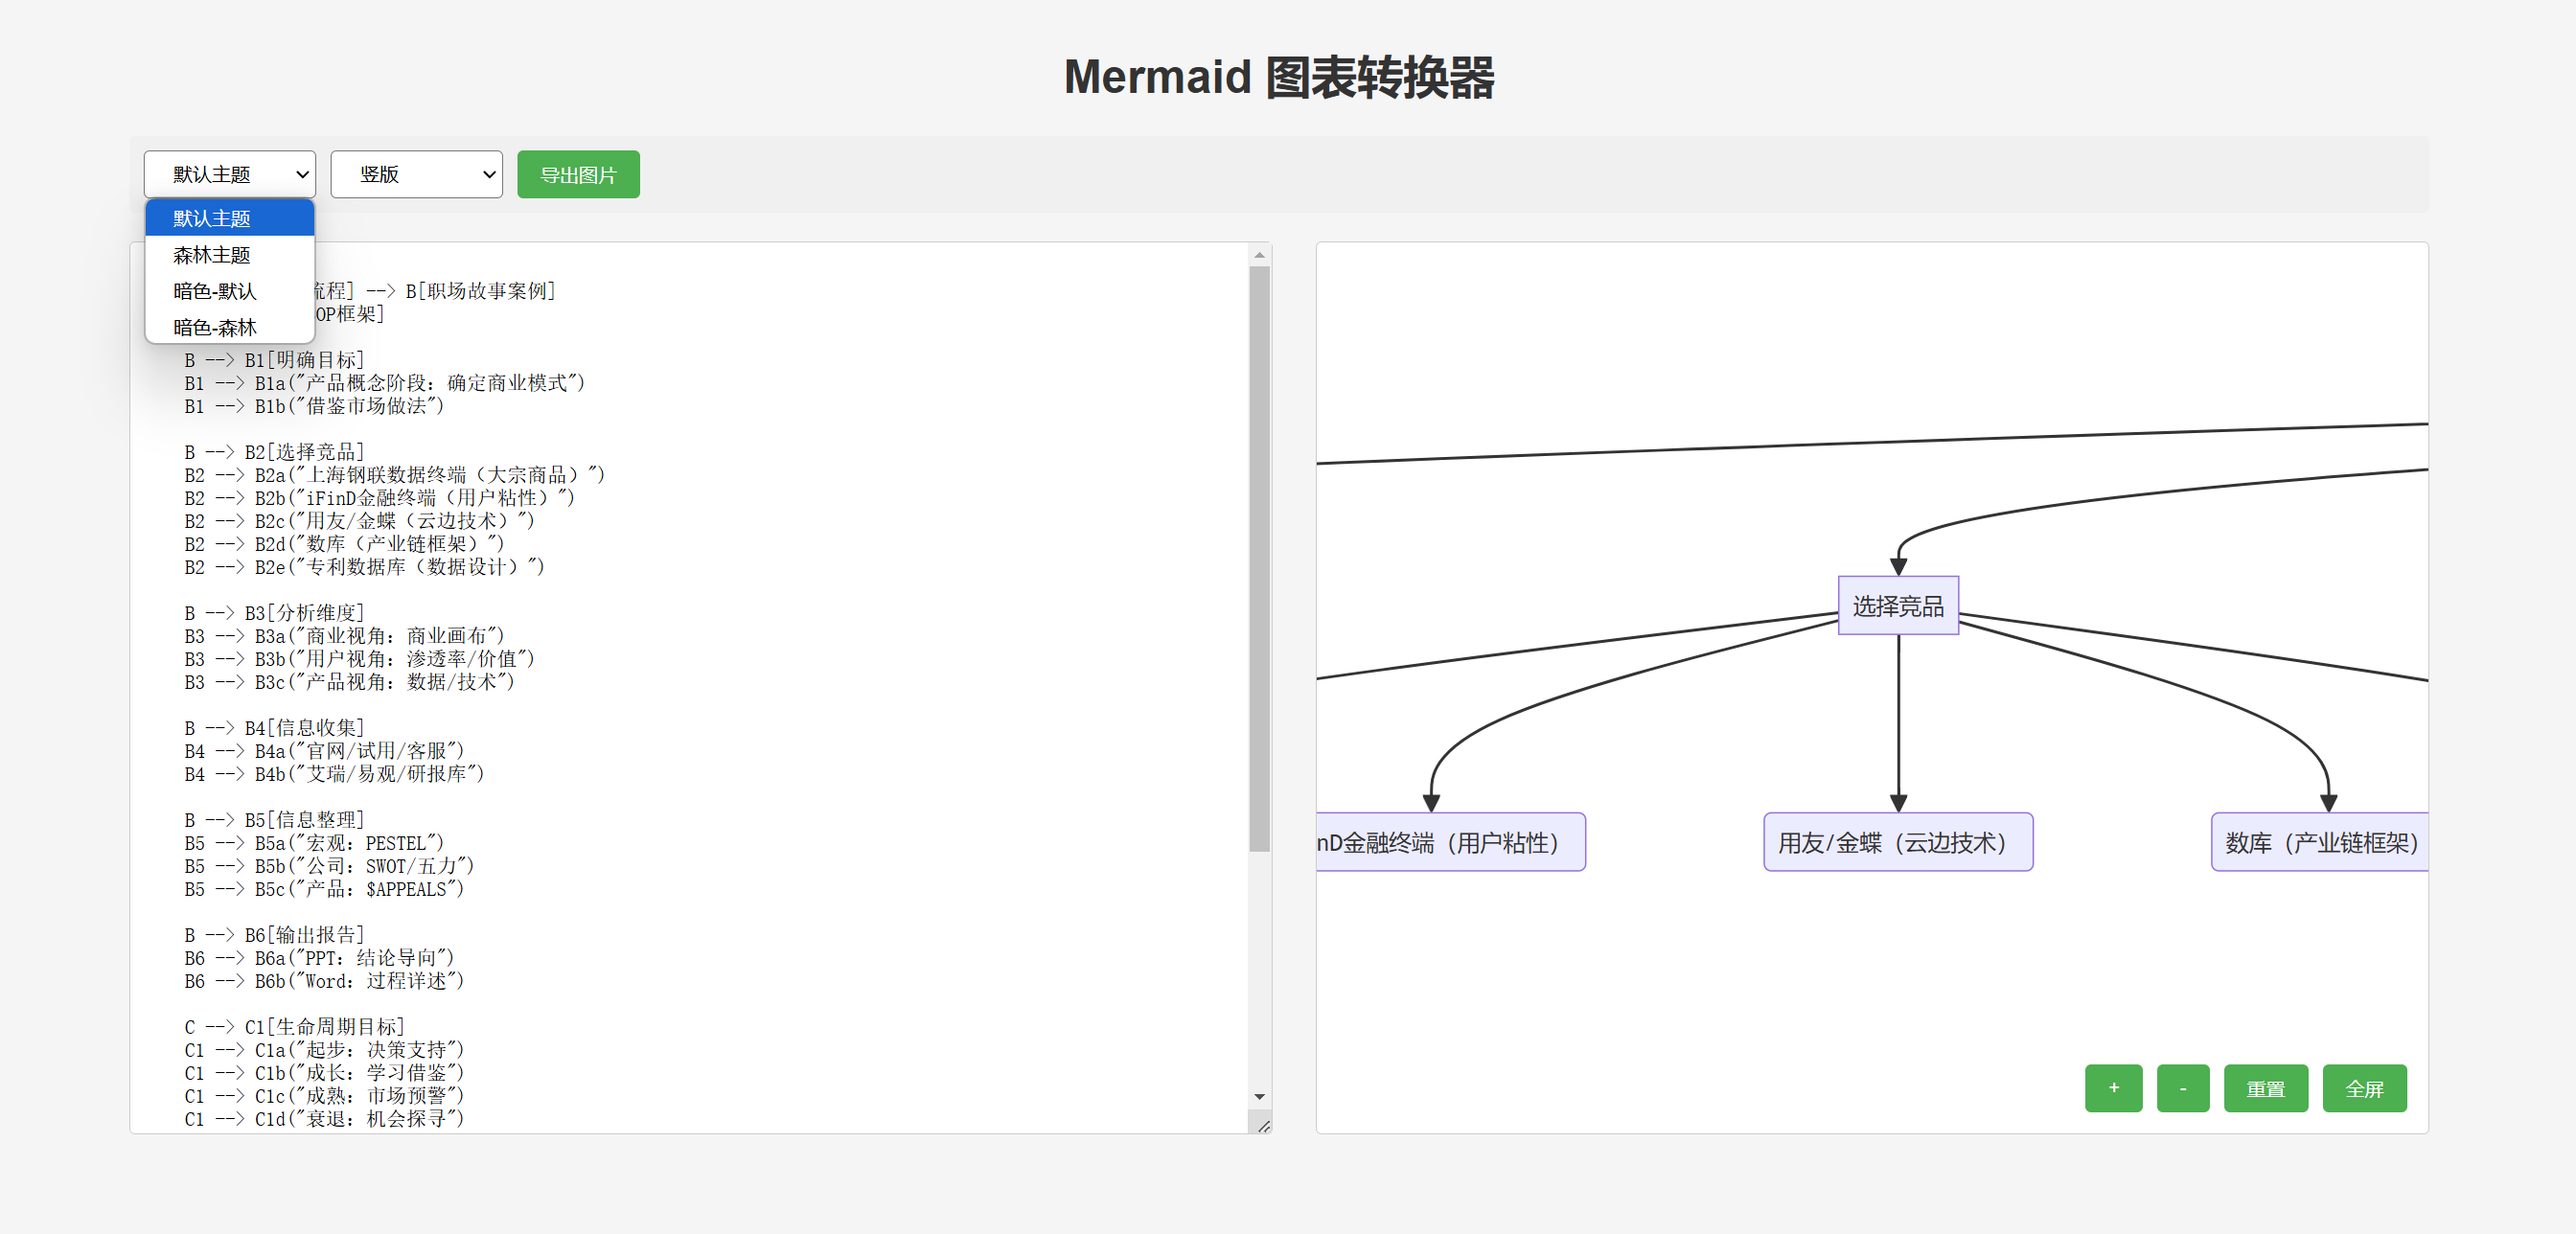
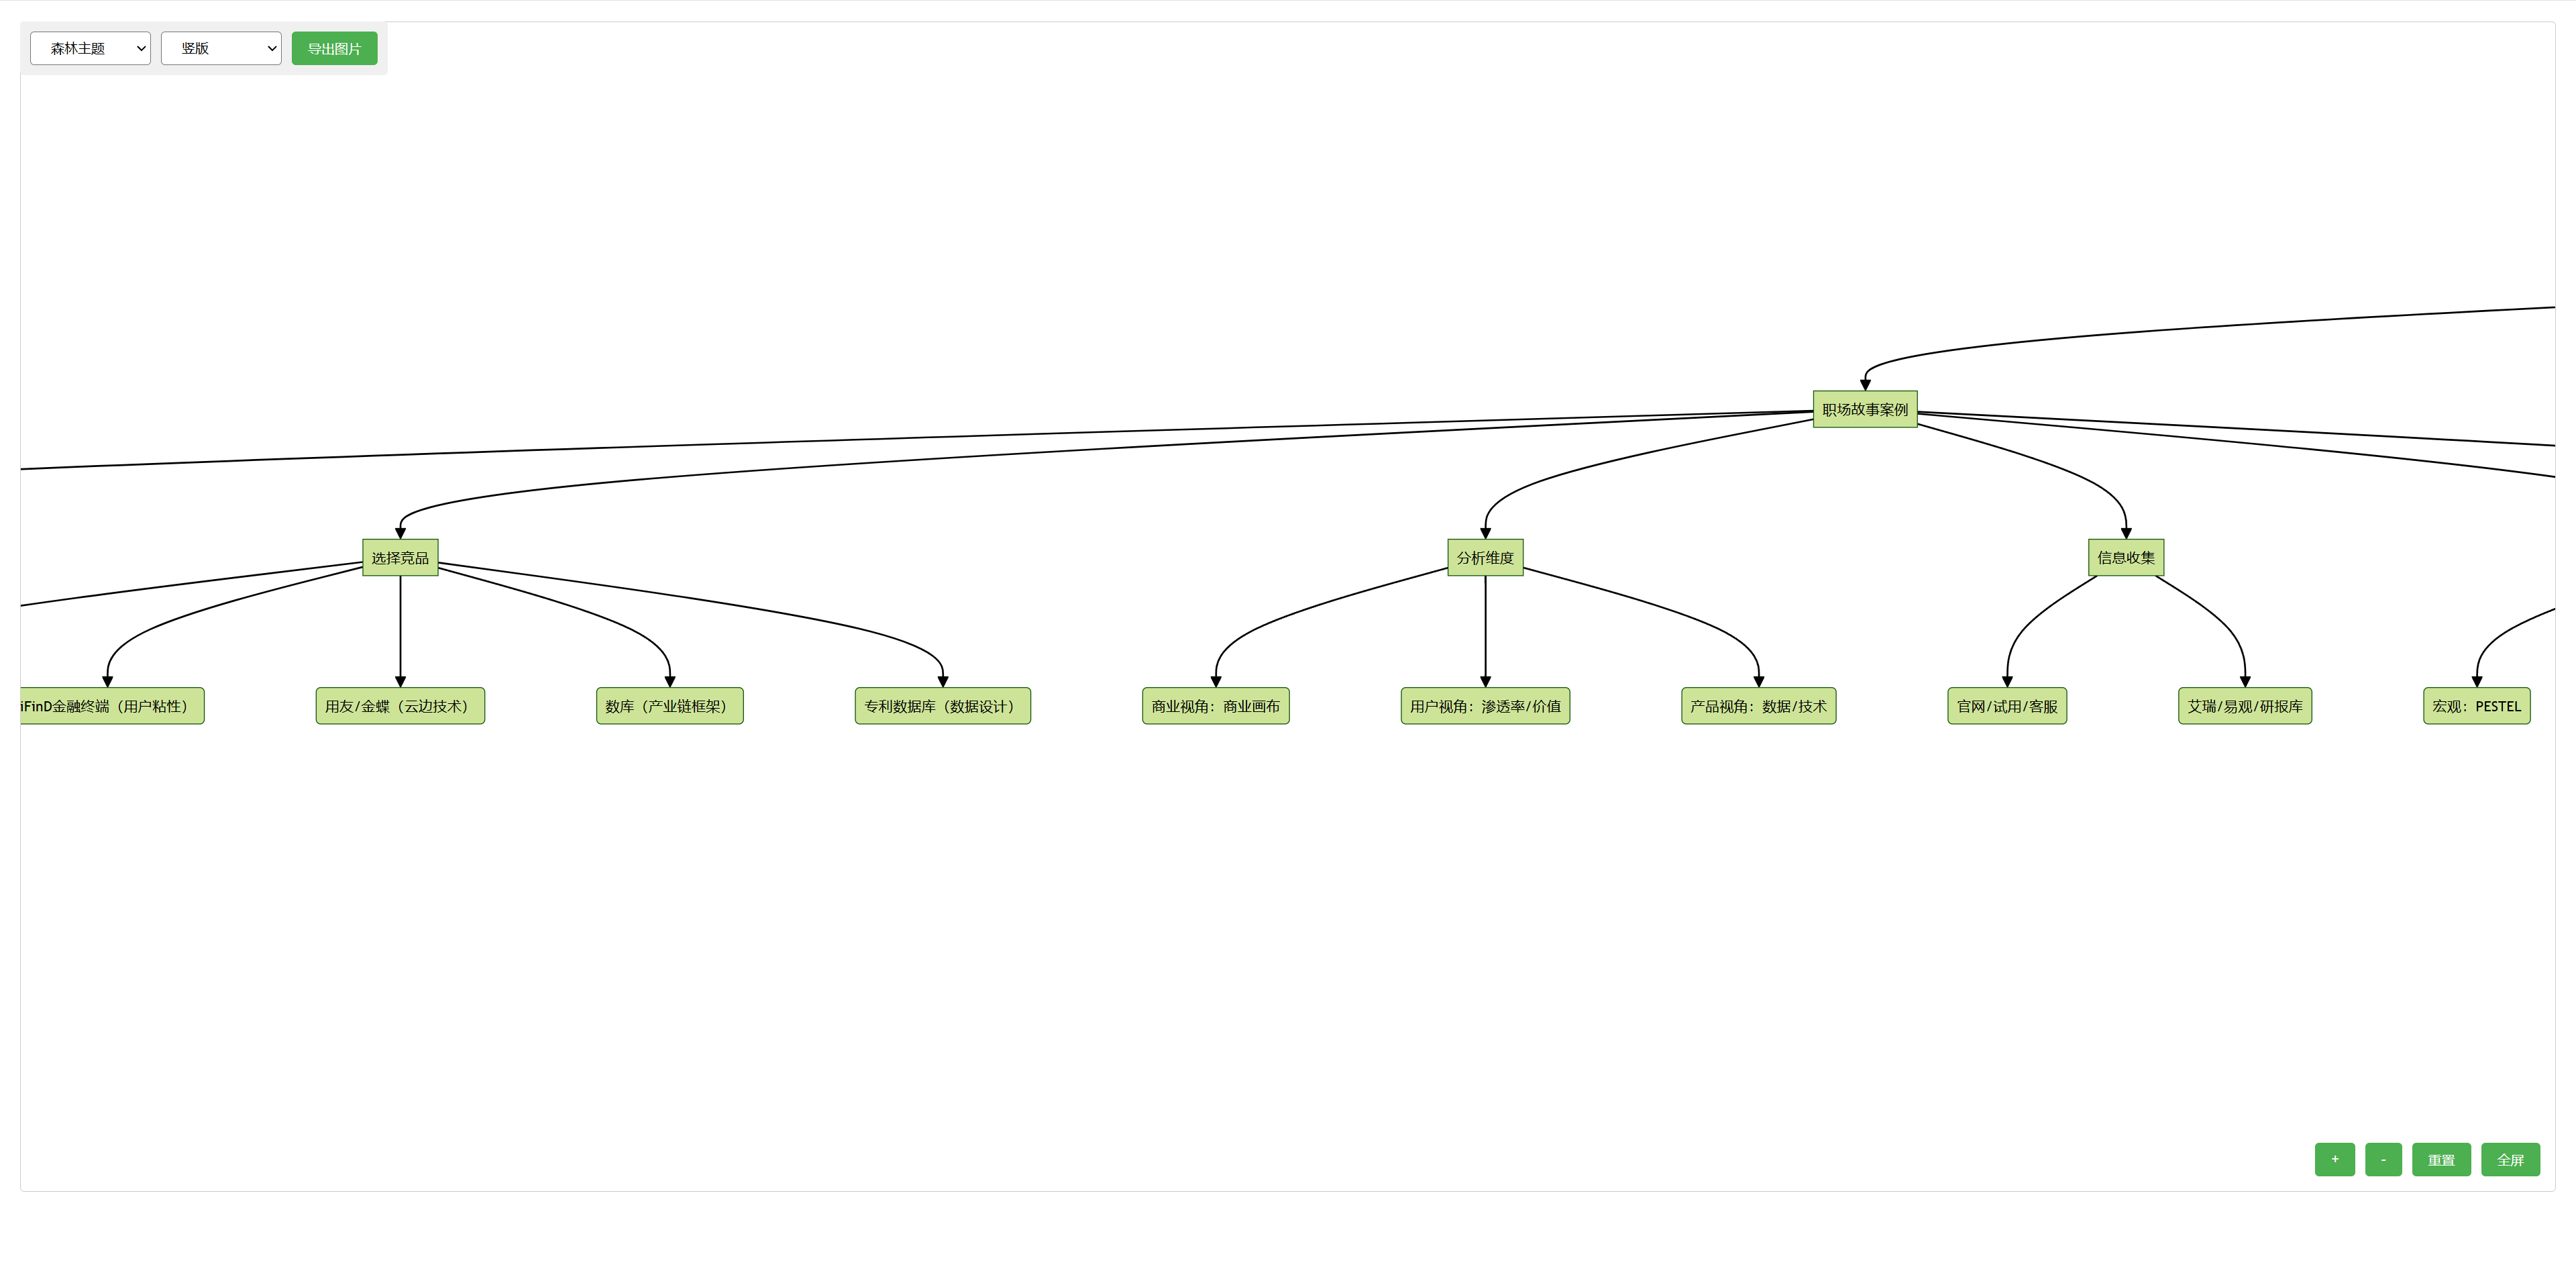
Ultimately, my Mermaid converter:
– Supports four themes and two backgrounds (black and white)
– Supports both horizontal and vertical layouts for flowcharts
– Supports mouse dragging and zooming with the scroll wheel without holding the Ctrl key (simply because I don’t like pressing the Ctrl key)
– Supports full-screen browsing
– Supports exporting the chart as a PNG in any browsing state, with much higher clarity than online websites
As usual, the source code is posted here:
<!DOCTYPE html>
Simply create a new text document, paste the code inside, change the file extension to ‘.html’, and it’s ready to use—you can also share it with others.
But as I always say, I recommend trying to write one yourself with the help of AI.